
 Surges Past $2,100 Amid Massive Short Squeeze and Strong ETF Inflows")
Key Highlights
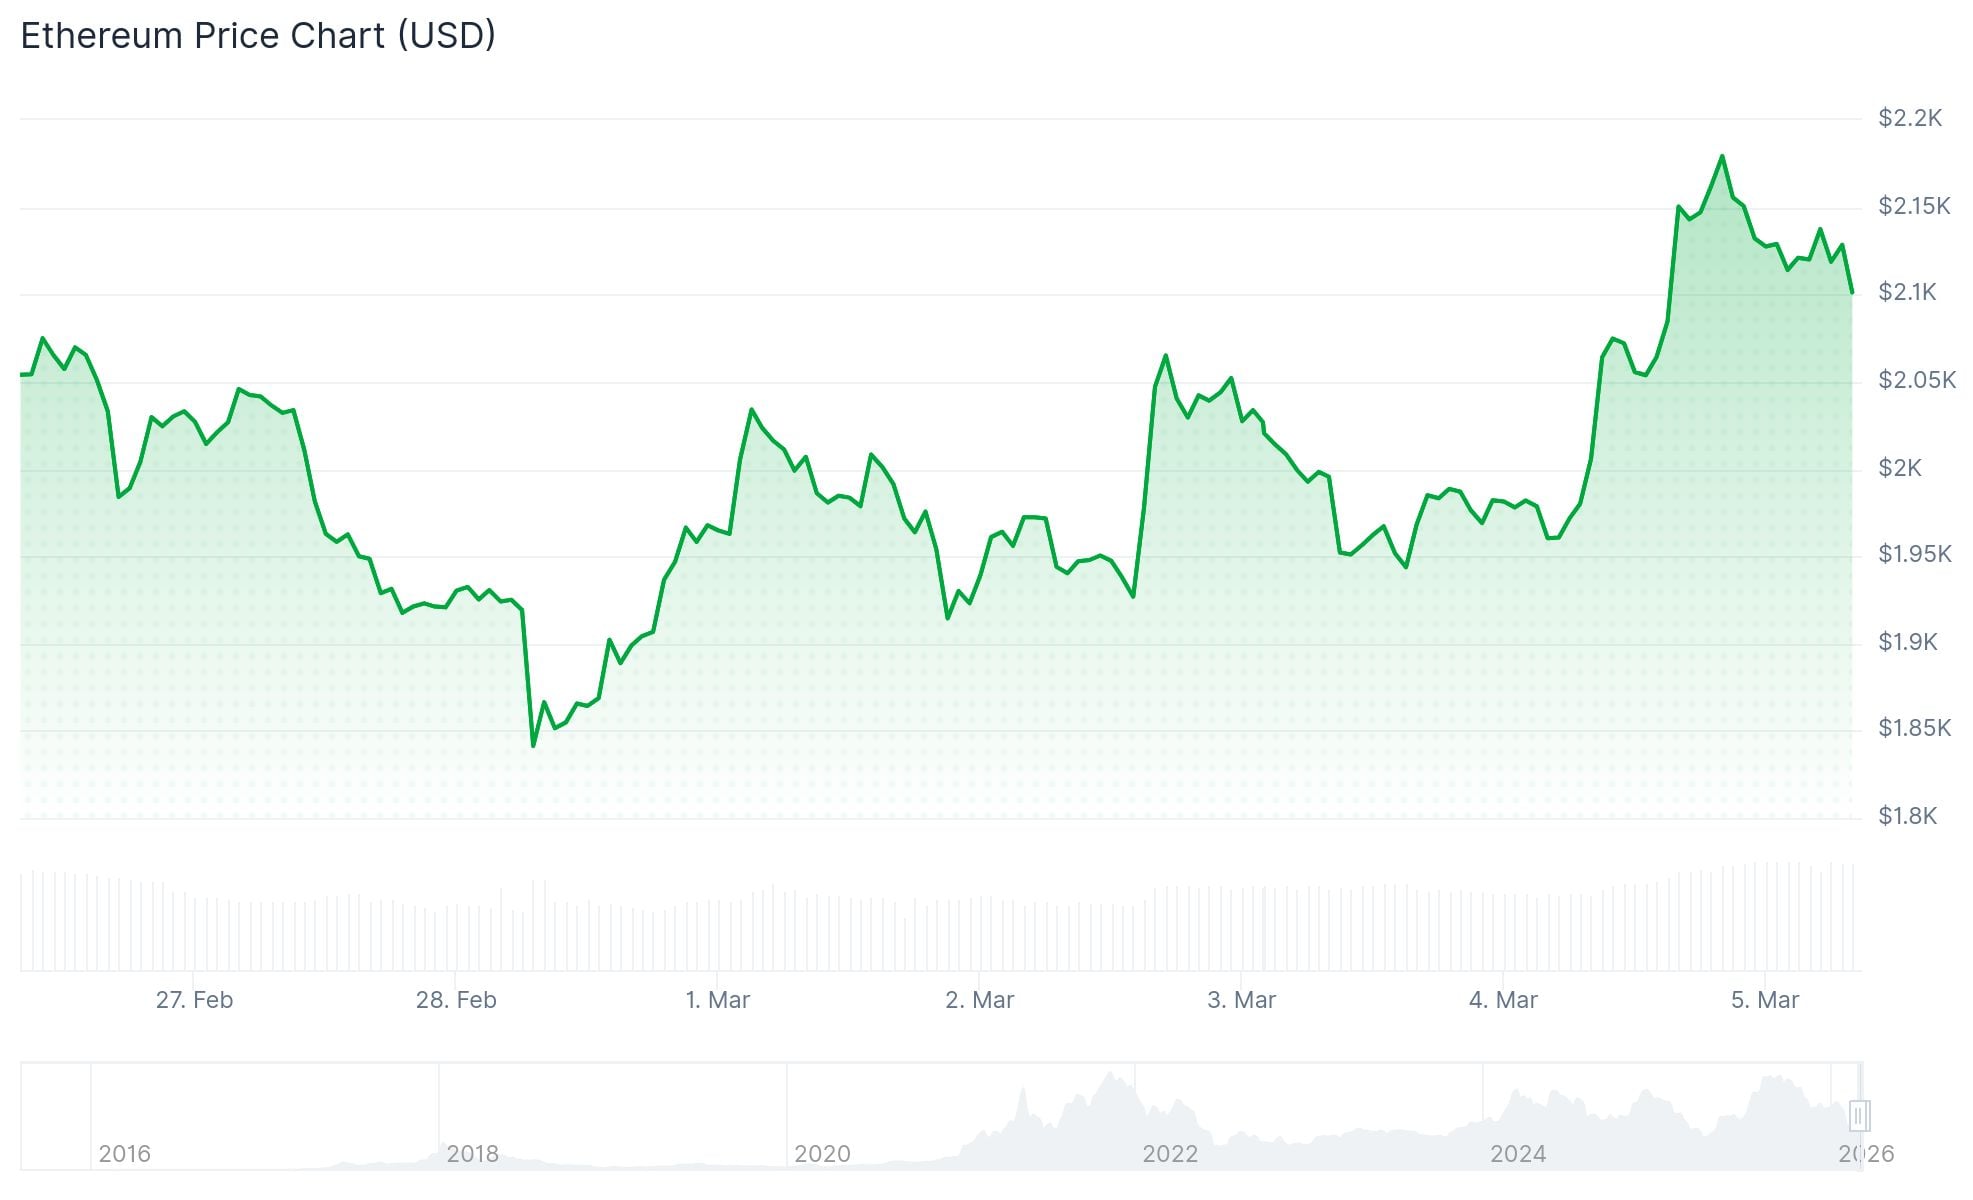
- ETH surged past $2,100 to touch a 4-week peak of $2,192 amid broader market strength
- Short liquidations exceeded $133 million within 24 hours, creating squeeze conditions
- Ethereum spot ETFs attracted $169.4 million in net inflows, signaling strong institutional interest
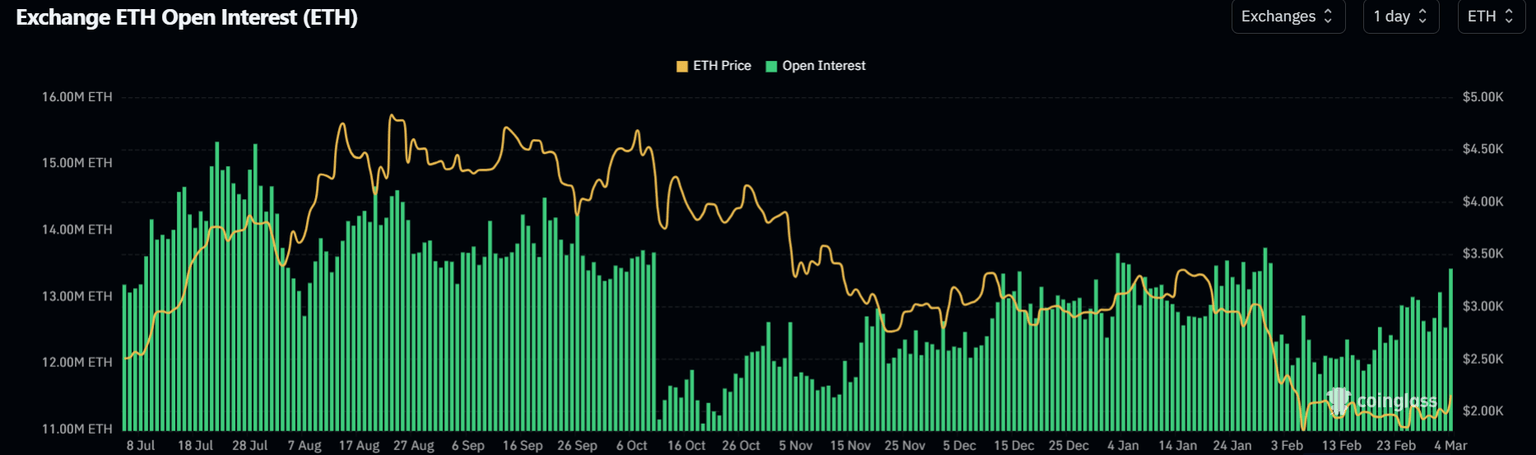
- Derivative open interest jumped nearly 15% to 13.43M ETH, marking a 5-week high
- Critical resistance zone between $2,150–$2,200; breakthrough could push toward $2,400 and $2,750
Ethereum (ETH) has staged an impressive comeback this week, breaking above the $2,100 threshold and touching $2,192—its strongest level in nearly a month—as digital asset markets experienced widespread gains.
The upward momentum gained traction following media coverage suggesting potential diplomatic dialogue between the United States and Iran, which boosted appetite for risk-oriented investments globally.
Bitcoin spearheaded the crypto market resurgence, pushing back above $73,000 for the first time since the opening weeks of February. Ethereum tracked this movement closely, posting gains exceeding 11% over a 24-hour window.
ETH trading activity surged by 24% during this timeframe, representing approximately 12% of the token’s total circulating supply value.
This price surge forced a significant unwinding of bearish bets. More than $133 million worth of short positions faced liquidation within a single day, contrasting sharply with only $21.5 million in long position liquidations, based on CoinGlass analytics.

Short liquidation volumes reached their most elevated point since late February, climbing to $430 million. Roughly $100 million of these forced closures involved ETH positions specifically, highlighting powerful short squeeze mechanics at work.
Institutional Capital Flows Resume
Spot Ethereum exchange-traded funds registered $169.4 million in positive flows within one trading session, according to Farside Investors’ tracking data. This movement indicates that institutional participants actively accumulated positions during the price advance.
Open interest across ETH futures and options contracts expanded by nearly 15% to reach 13.43M ETH—the most substantial reading observed since the final day of January. This metric has increased by 1.2M ETH over the preceding two-week period.
Funding rates currently show slight negative values at press time, though market observers suggest a rotation toward positive territory would validate a sustained bullish outlook.
Critical Price Zones Ahead
On the daily timeframe, Ethereum has established a double bottom formation. The pattern’s neckline intersects at $2,200, representing an important psychological barrier.
A decisive move above $2,200 could propel ETH toward $2,400, which corresponds with the 38.2% Fibonacci retracement zone.
The Relative Strength Index currently registers 53, positioned above the midpoint, indicating strengthening momentum following oversold territory in prior weeks.
The MACD indicator has printed a bullish crossover signal, while the Aroon Up metric stands at 92.86%, significantly outpacing the bearish Aroon Down reading of 35.71%.
Ethereum’s realized price—representing the aggregate on-chain acquisition cost across all holders—hovers around $2,300. Approaching this threshold may prompt selling pressure from investors seeking to exit at breakeven levels.
Near-term support establishes itself at $2,108, where current price action intersects the 20-day exponential moving average. Failing to hold this level could expose $1,741 as the next downside target.
ETH was changing hands at $2,117 at publication time, sitting just 1.1% beneath the 23.6% Fibonacci level positioned at $2,142.
Get 3 Free Stock Ebooks
Discover top-performing stocks in AI, Crypto, and Technology with expert analysis.
- Top 10 AI Stocks - Leading AI companies
- Top 10 Crypto Stocks - Blockchain leaders
- Top 10 Tech Stocks - Tech giants

