
 Surges Past $2,100 as ETFs Attract $120M in Fresh Capital")
Key Highlights
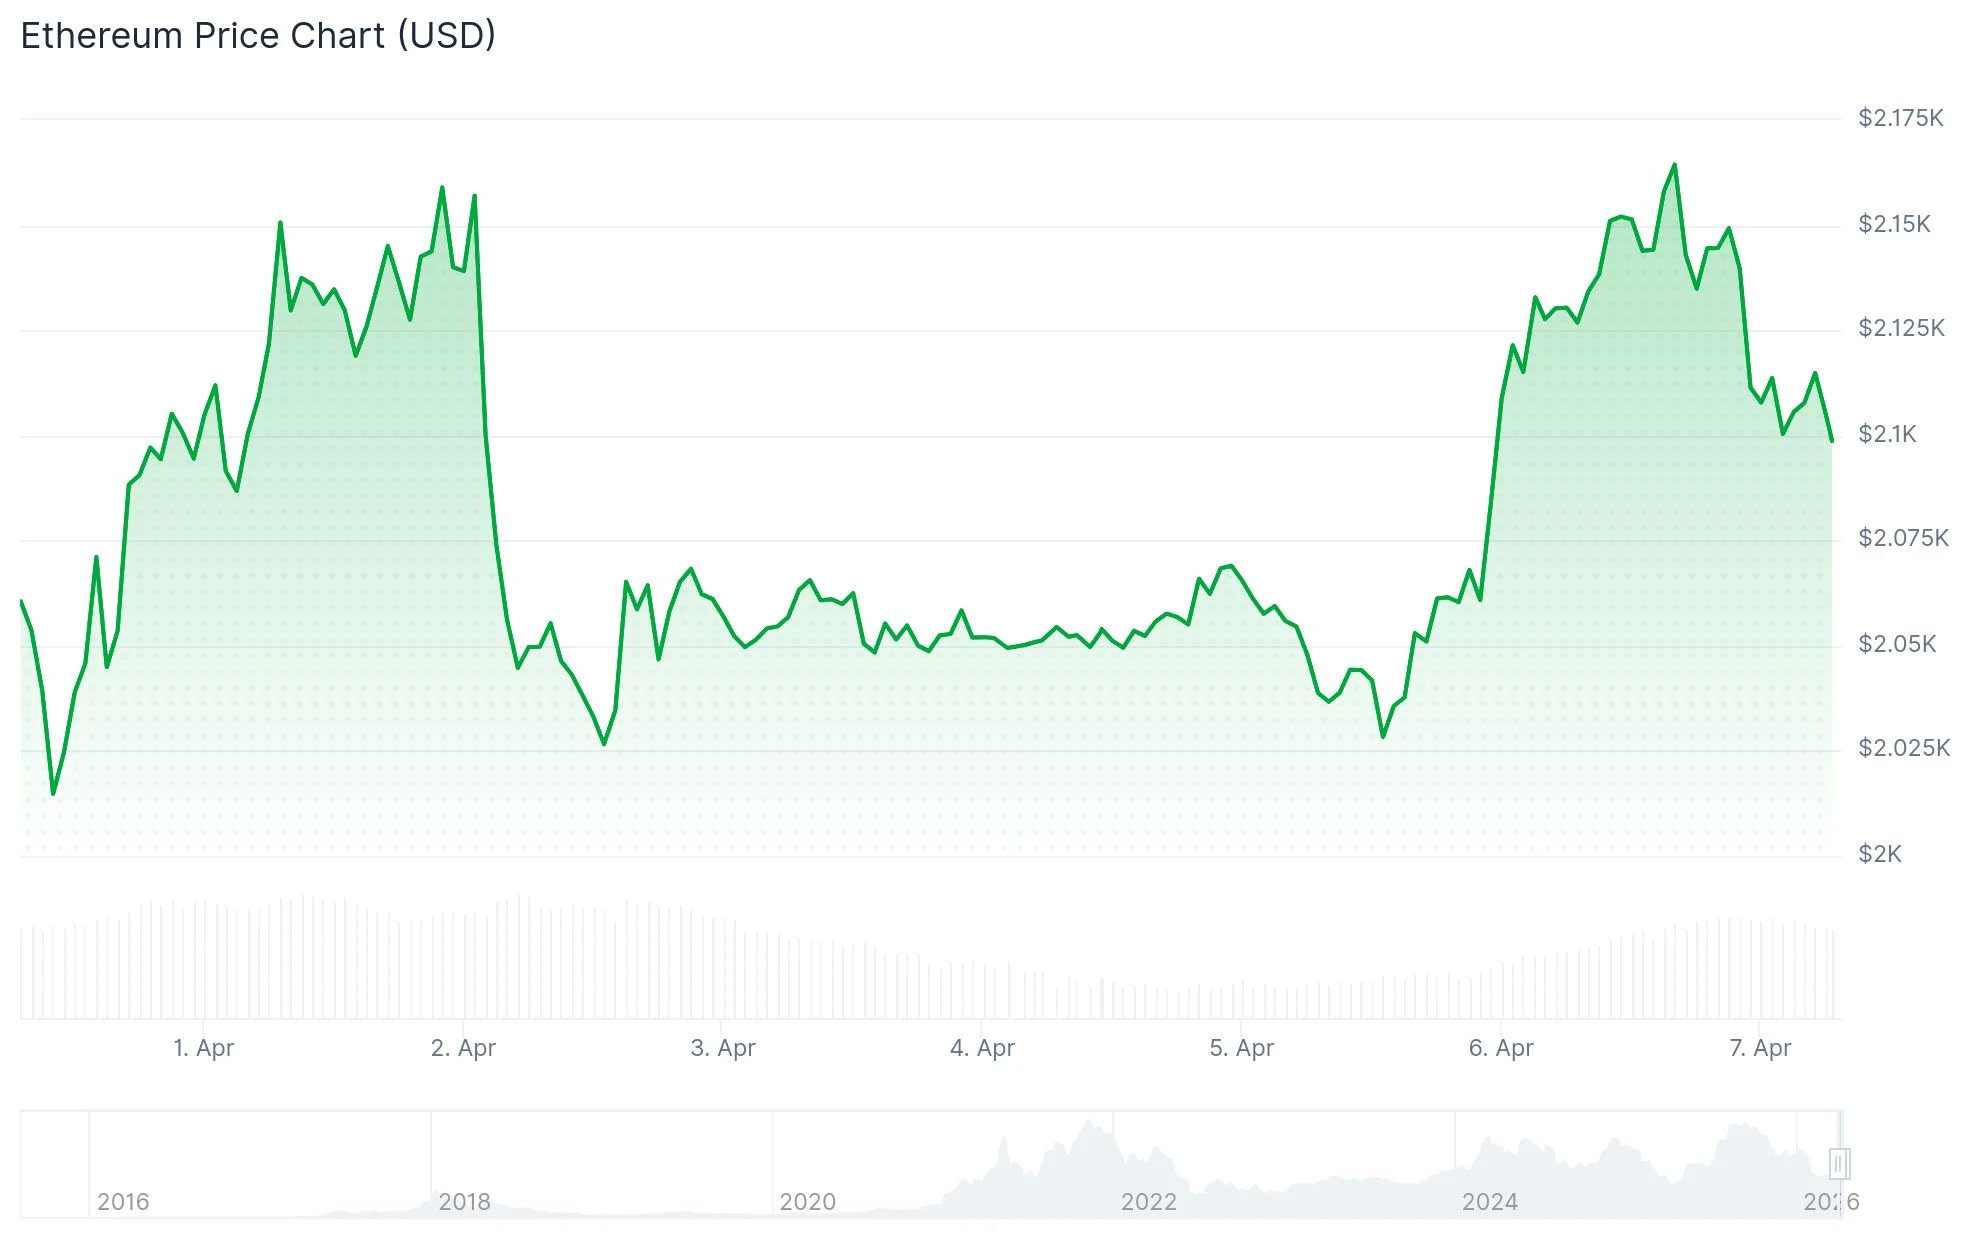
- ETH has recaptured the $2,100 price level following a sustained defense of the $2,000 support zone
- Weekly MACD indicator shows upward momentum forming, mirroring past patterns that preceded rallies
- Daily trading volume surged to $16 billion, representing a 100% increase within 24 hours following a 5%+ gain
- Spot Ethereum ETFs registered $120 million in net positive flows on April 6, with BlackRock’s ETHA dominating
- Breaking through the $2,150 resistance could set the stage for a potential advance toward $2,800
Ethereum has posted a robust gain exceeding 5% over the last day, successfully reclaiming the psychologically important $2,100 threshold that market participants have closely monitored. The upward momentum coincided with President Donald Trump issuing warnings to Iran regarding Strait of Hormuz access, temporarily alleviating concerns about oil prices and providing support to risk-on assets.
The surge in price action corresponded with a dramatic expansion in trading activity, with daily volume climbing to $16 billion—more than double the previous day’s figures. This volume equates to approximately 6% of Ethereum’s entire circulating market capitalization.
The rally triggered widespread liquidations across cryptocurrency markets, with roughly $280 million in short positions being forced to close. During this timeframe, Bitcoin advanced 4%, Solana climbed 3.5%, and XRP registered a 3% increase.
Prior to the rebound, ETH found solid footing at the $2,000 threshold, establishing what technical observers characterize as a higher low formation on daily timeframes. The asset is currently challenging resistance in the vicinity of $2,150, a barrier that has proven stubborn in recent attempts.
Market analyst Ted published a technical chart illustrating ETH’s bounce from a confluence of support levels and subsequent recapture of $2,100. His analysis identifies key resistance zones positioned at $2,200, the mid-$2,400 territory, and $2,624 beyond that.

The Relative Strength Index has climbed above the 55 mark and crossed above its 14-day moving average. According to the technical framework, a breakthrough above 60 on the RSI would strengthen the case for continued upward momentum.
Weekly MACD Pattern Hints at Momentum Reversal
Technical analyst Jake Wujastyk highlighted a weekly chart displaying Ethereum’s MACD indicator beginning to turn upward from deeply oversold territory. The blue MACD line is advancing toward the orange signal line after an extended downward trajectory.
Historical precedent on the same chart reveals that comparable configurations have emerged near market bottoms before substantial price appreciation occurred in subsequent weeks. While this development doesn’t constitute a confirmed breakout, it suggests diminishing bearish pressure.
Analyst Ali Charts identified the $1,800 level as a pivotal support threshold, characterizing the current price structure as a potential ascending triangle formation. In his analysis, he noted that maintaining $1,800 as the pattern’s foundation could enable a rally extending toward $4,900.
Spot ETF Activity Reflects Growing Institutional Interest
Ethereum spot exchange-traded funds captured $120 million in aggregate net inflows on April 6. BlackRock’s ETHA dominated the flow data with $60.8 million in single-session additions, pushing its cumulative historical inflow to $11.62 billion.
Fidelity’s FETH secured the second position with $40.1 million in fresh capital. Combined net assets across all Ethereum spot ETFs have reached $12.28 billion, accounting for 4.74% of Ethereum’s overall market capitalization.
The crypto Fear and Greed Index advanced from 23 to 38, transitioning from the Fear zone toward Almost Neutral territory.
The CME FedWatch tool indicates that market participants have removed expectations for any rate reduction in 2026, a development that has applied downward pressure on risk-sensitive assets more broadly. Following a week that concluded with $42 million in outflows, Ethereum ETFs experienced a notable reversal on April 6 with the substantial inflow activity.
Get 3 Free Stock Ebooks
Discover top-performing stocks in AI, Crypto, and Technology with expert analysis.
- Top 10 AI Stocks - Leading AI companies
- Top 10 Crypto Stocks - Blockchain leaders
- Top 10 Tech Stocks - Tech giants

