

TLDR
- Ethereum touched $2,150 this week before retreating, encountering resistance from several technical benchmarks
- The $2,100 level represents a critical threshold, matching the cost basis of whale wallets holding over 100,000 ETH
- The 30-day realized volatility for ETH has climbed to approximately 0.97, marking the highest level since March 2025
- Short squeeze activity intensified with $220M in liquidations across 48 hours, while funding rates shifted into positive territory
- ETF outflow pressure is diminishing, although definitive accumulation patterns remain absent
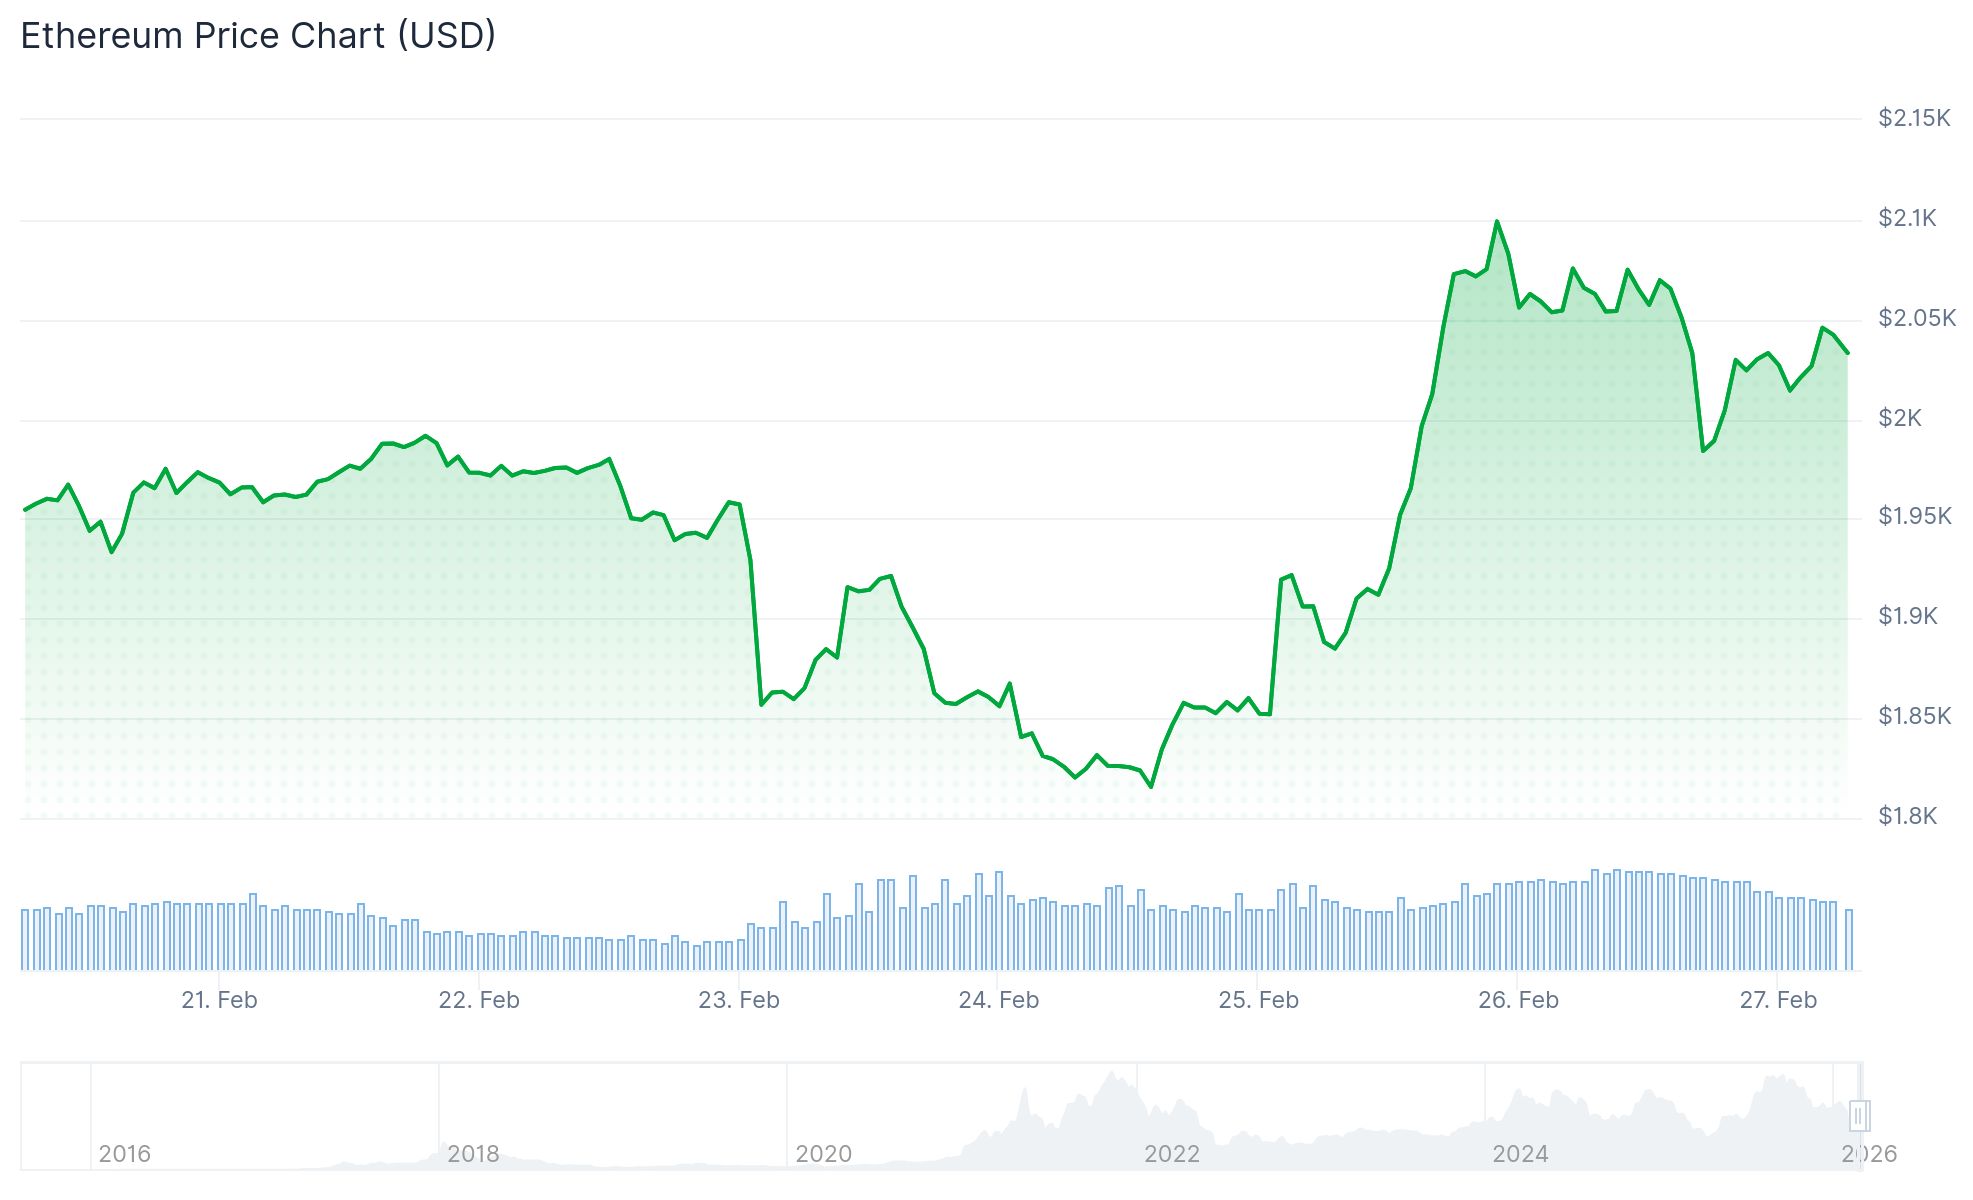
Ethereum’s price action pushed toward a weekly peak of $2,150 on Thursday before experiencing a pullback. Trading has remained confined within a narrow band, with $2,000 serving as crucial support while $2,100 represents the next significant resistance zone.
The $2,100 threshold carries particular significance as it corresponds to the realized price for addresses holding 100,000 ETH or greater. This metric, which reflects the average acquisition cost based on the last on-chain movement, serves as a gauge for whether major holders maintain profitable positions.
Historical data from 2020 onward reveals that ETH has rarely traded beneath this whale cohort’s average cost basis, with the most notable exception occurring throughout the 2022 downturn. Previous tests of this level have consistently preceded price recoveries.
Futures and Funding Rates
The derivatives market witnessed aggressive short liquidations exceeding $220 million within a two-day window, eliminating substantial leveraged positioning. Binance funding rates, which had plunged into deeply negative territory early this month as bearish bets accumulated, have now reversed to a positive 0.23%.
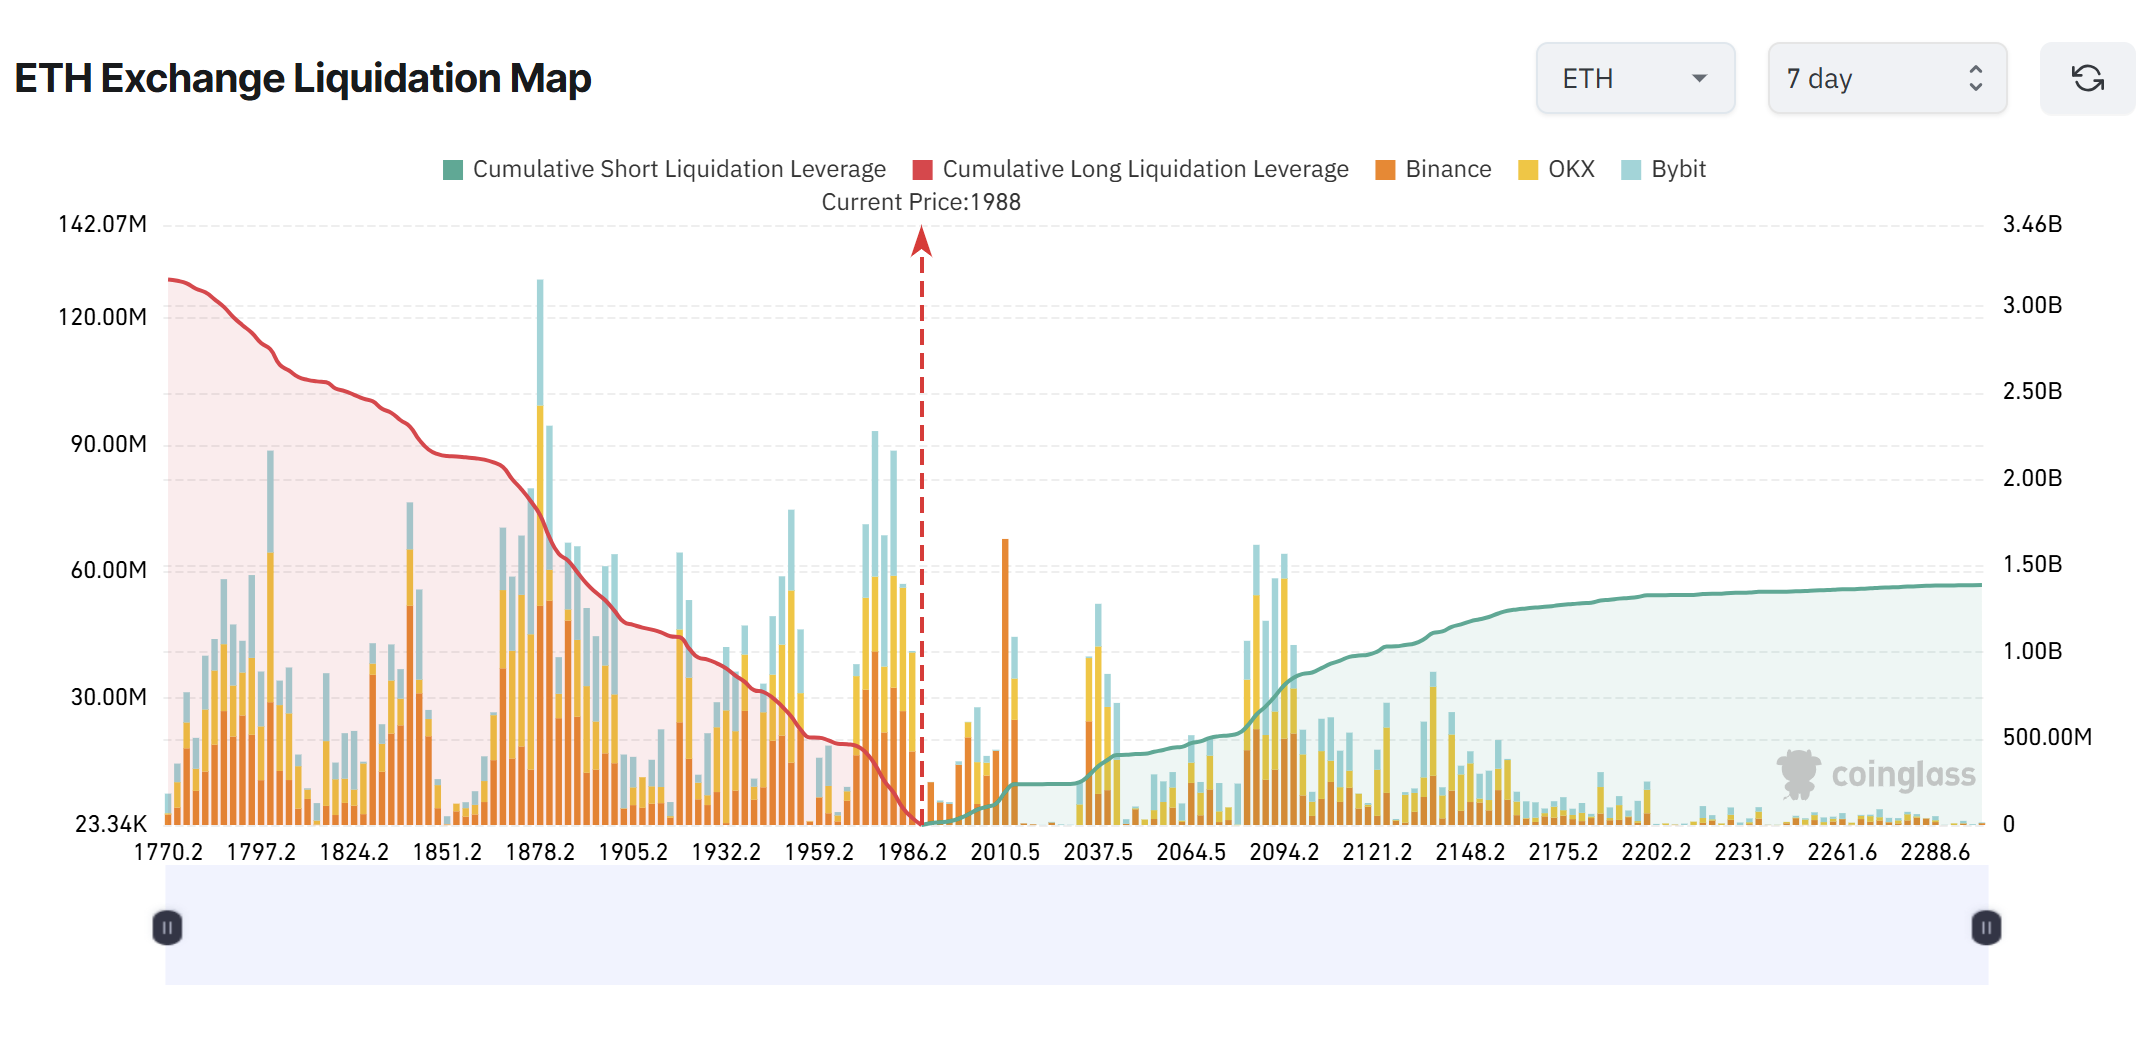
This reversal indicates that overleveraged short positions have been flushed from the system. Nevertheless, the current elevated positive funding rate suggests a crowded long side, creating potential vulnerability for downside moves toward $1,800 should bullish momentum falter.

Approximately $2.66 billion in long position liquidation levels cluster around the $1,800 mark, establishing a significant liquidity pocket beneath current trading ranges.
Volatility and ETF Flows
Ethereum’s 30-day realized volatility on Binance has spiked to nearly 0.97, representing the most elevated reading observed since March 2025. Such heightened volatility typically indicates market uncertainty and directional searching rather than established trending behavior.
Price remains positioned beneath all major moving averages, including the 50-day, 100-day, and 200-day lines. Each recovery attempt following the rejection from the $4,800 region in late 2025 has established progressively lower peaks, indicating persistent distribution pressure.
Regarding institutional flows, ETF selling momentum has shown signs of exhaustion. Following substantial outflows throughout mid-2025, recent data demonstrates more modest movement in either direction. While institutional distribution appears to be waning, accumulation signals have yet to materialize convincingly.
Market analyst Leon Waidmann observed that speculative weak hands have predominantly exited their positions. Short interest continues declining, though aggressive long positioning has not aggressively filled the void.
Technical strategist IncomeSharks identified three critical resistance zones, including repeated SuperTrend rejections and channel resistance approaching $2,250. The analyst additionally highlighted the April lows surrounding $1,500 as a downside level warranting attention should demand weaken further.
At the time of publication, ETH was changing hands at $2,034.
Get 3 Free Stock Ebooks
Discover top-performing stocks in AI, Crypto, and Technology with expert analysis.
- Top 10 AI Stocks - Leading AI companies
- Top 10 Crypto Stocks - Blockchain leaders
- Top 10 Tech Stocks - Tech giants

