

TLDR
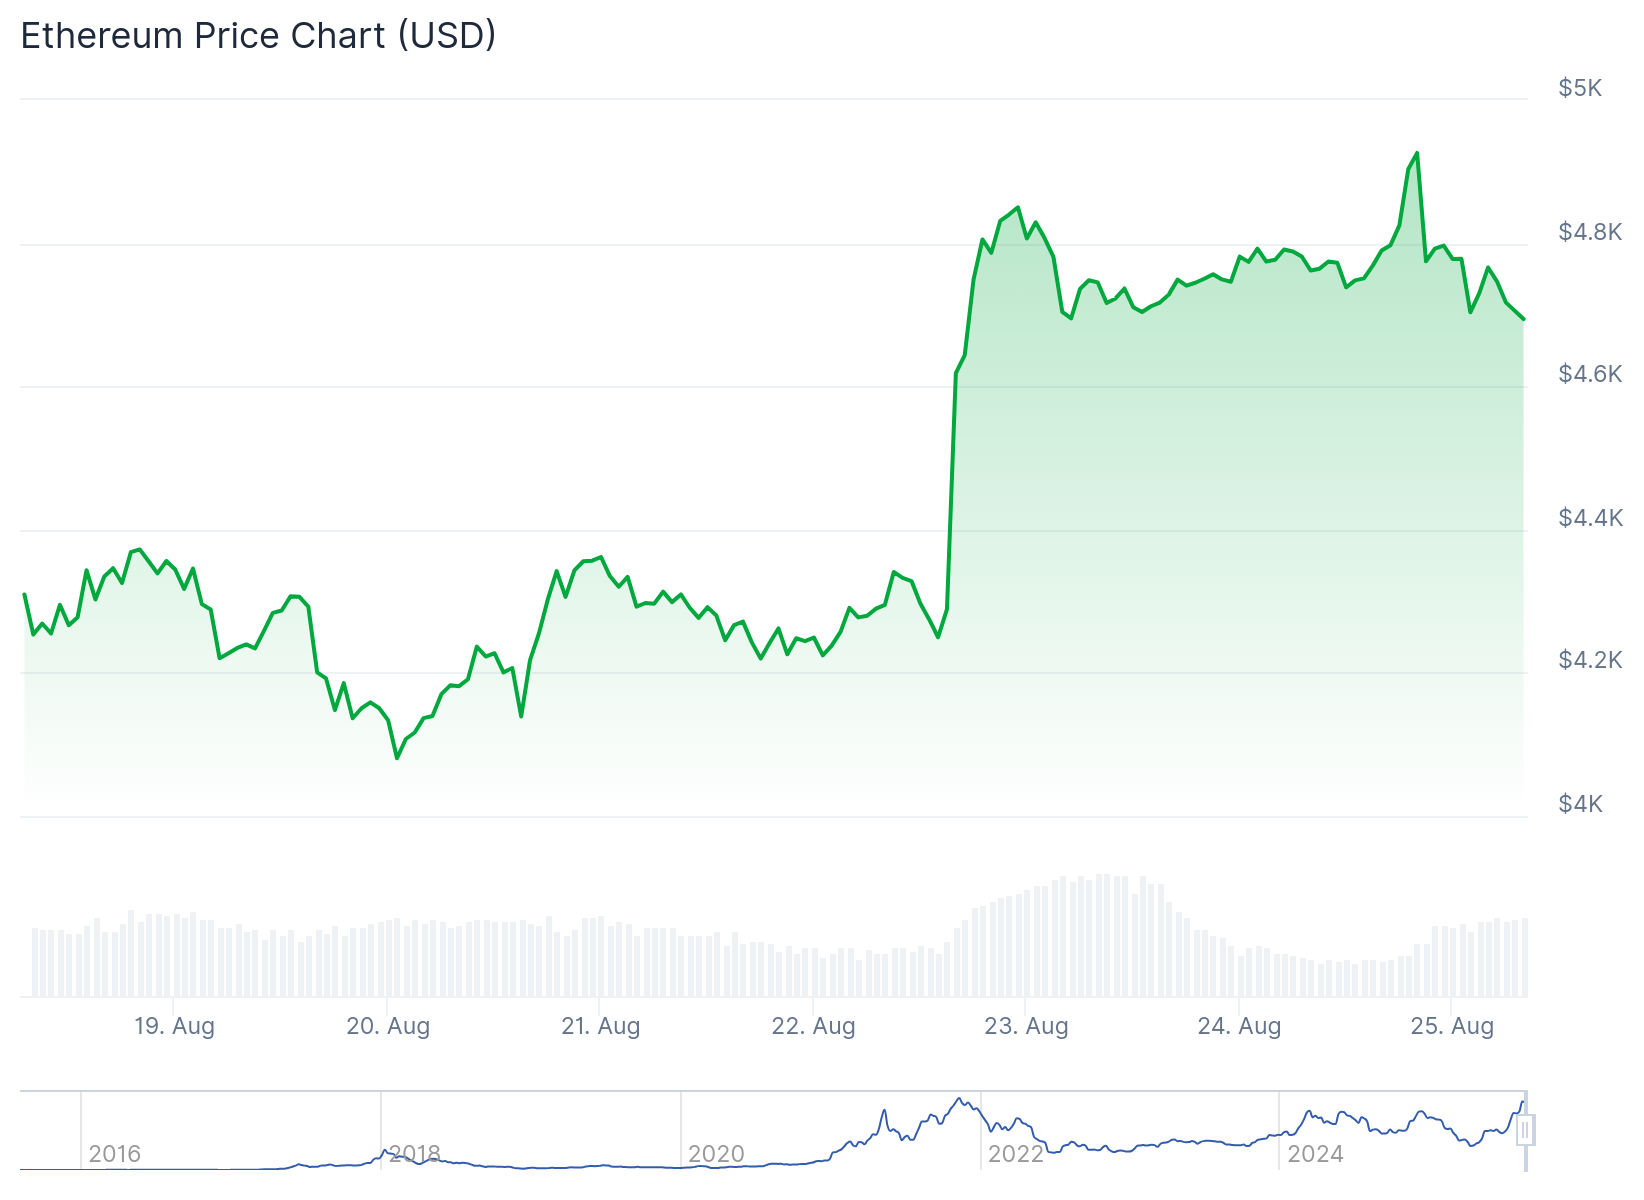
- Ethereum surged 25% in August 2025, climbing from $3,807 to over $4,700
- Historical data reveals September is ETH’s worst month with 6.42% average losses since 2016
- Spot Ethereum ETFs attracted $3 billion in net inflows during August
- Corporate treasuries now hold $17 billion in ETH, led by BitMINE’s $6.6 billion position
- Past August rallies in 2017, 2020, and 2021 all preceded September selloffs
Ethereum has posted impressive gains throughout August 2025, climbing 25% to trade above $4,700. The world’s second-largest cryptocurrency reached new highs above $4,867 following Federal Reserve Chair Jerome Powell’s dovish comments at Jackson Hole.
Powell’s hints about potential September rate cuts have energized crypto markets. However, historical patterns suggest Ethereum investors should prepare for potential weakness ahead.
Since 2016, September has consistently been Ethereum’s worst-performing month. The cryptocurrency has averaged losses of 6.42% during September across multiple market cycles.
The pattern becomes more pronounced following strong August performance. Only three times since 2016 has Ethereum posted August gains – and each instance led to September declines.

Record Institutional Demand Drives August Performance
Spot Ethereum ETFs have attracted nearly $3 billion in net inflows during August 2025. This contrasts sharply with Bitcoin ETFs, which saw $1.2 billion in net outflows over the same period.
Corporate adoption has reached unprecedented levels. Companies now collectively hold over $17 billion in Ethereum reserves, with BitMINE leading at $6.6 billion in holdings.

BitMINE recently purchased an additional $45 million worth of ETH, bringing their total position to $7 billion. This institutional accumulation has helped reduce liquid supply and support price momentum.
Bitcoin’s market dominance has fallen 5.88% to 58.19% over 30 days. This decline typically indicates capital rotation into alternative cryptocurrencies beyond Bitcoin.
Historical September Weakness Pattern Persists
The September selloff pattern spans multiple market cycles. In 2017, Ethereum surged 92.86% in August before plummeting 21.65% in September following China’s ICO ban announcement.
The 2020 cycle showed similar dynamics with a 25.32% August gain followed by a 17.08% September decline. In 2021, Ethereum climbed 35.62% in August then dropped 12.55% the following month.
Crypto analysts have highlighted this seasonal weakness on social platforms. Many question whether 2025 will break the established pattern given new market dynamics.
Analysts Remain Bullish Despite Seasonal Headwinds
Standard Chartered Bank forecasts Ethereum reaching $7,500 by year-end 2025, with longer-term targets of $12,000 in 2026 and $18,000 by 2027.
Tom Lee expects Ethereum to “keep charging ahead” driven by ETF flows and institutional adoption, with prices potentially exceeding $7,000.
The presence of spot ETH ETFs and corporate treasury adoption represents new market forces absent during previous cycles. These institutional flows could potentially disrupt historical seasonal patterns as September approaches.
Get 3 Free Stock Ebooks
Discover top-performing stocks in AI, Crypto, and Technology with expert analysis.
- Top 10 AI Stocks - Leading AI companies
- Top 10 Crypto Stocks - Blockchain leaders
- Top 10 Tech Stocks - Tech giants

