

TLDR
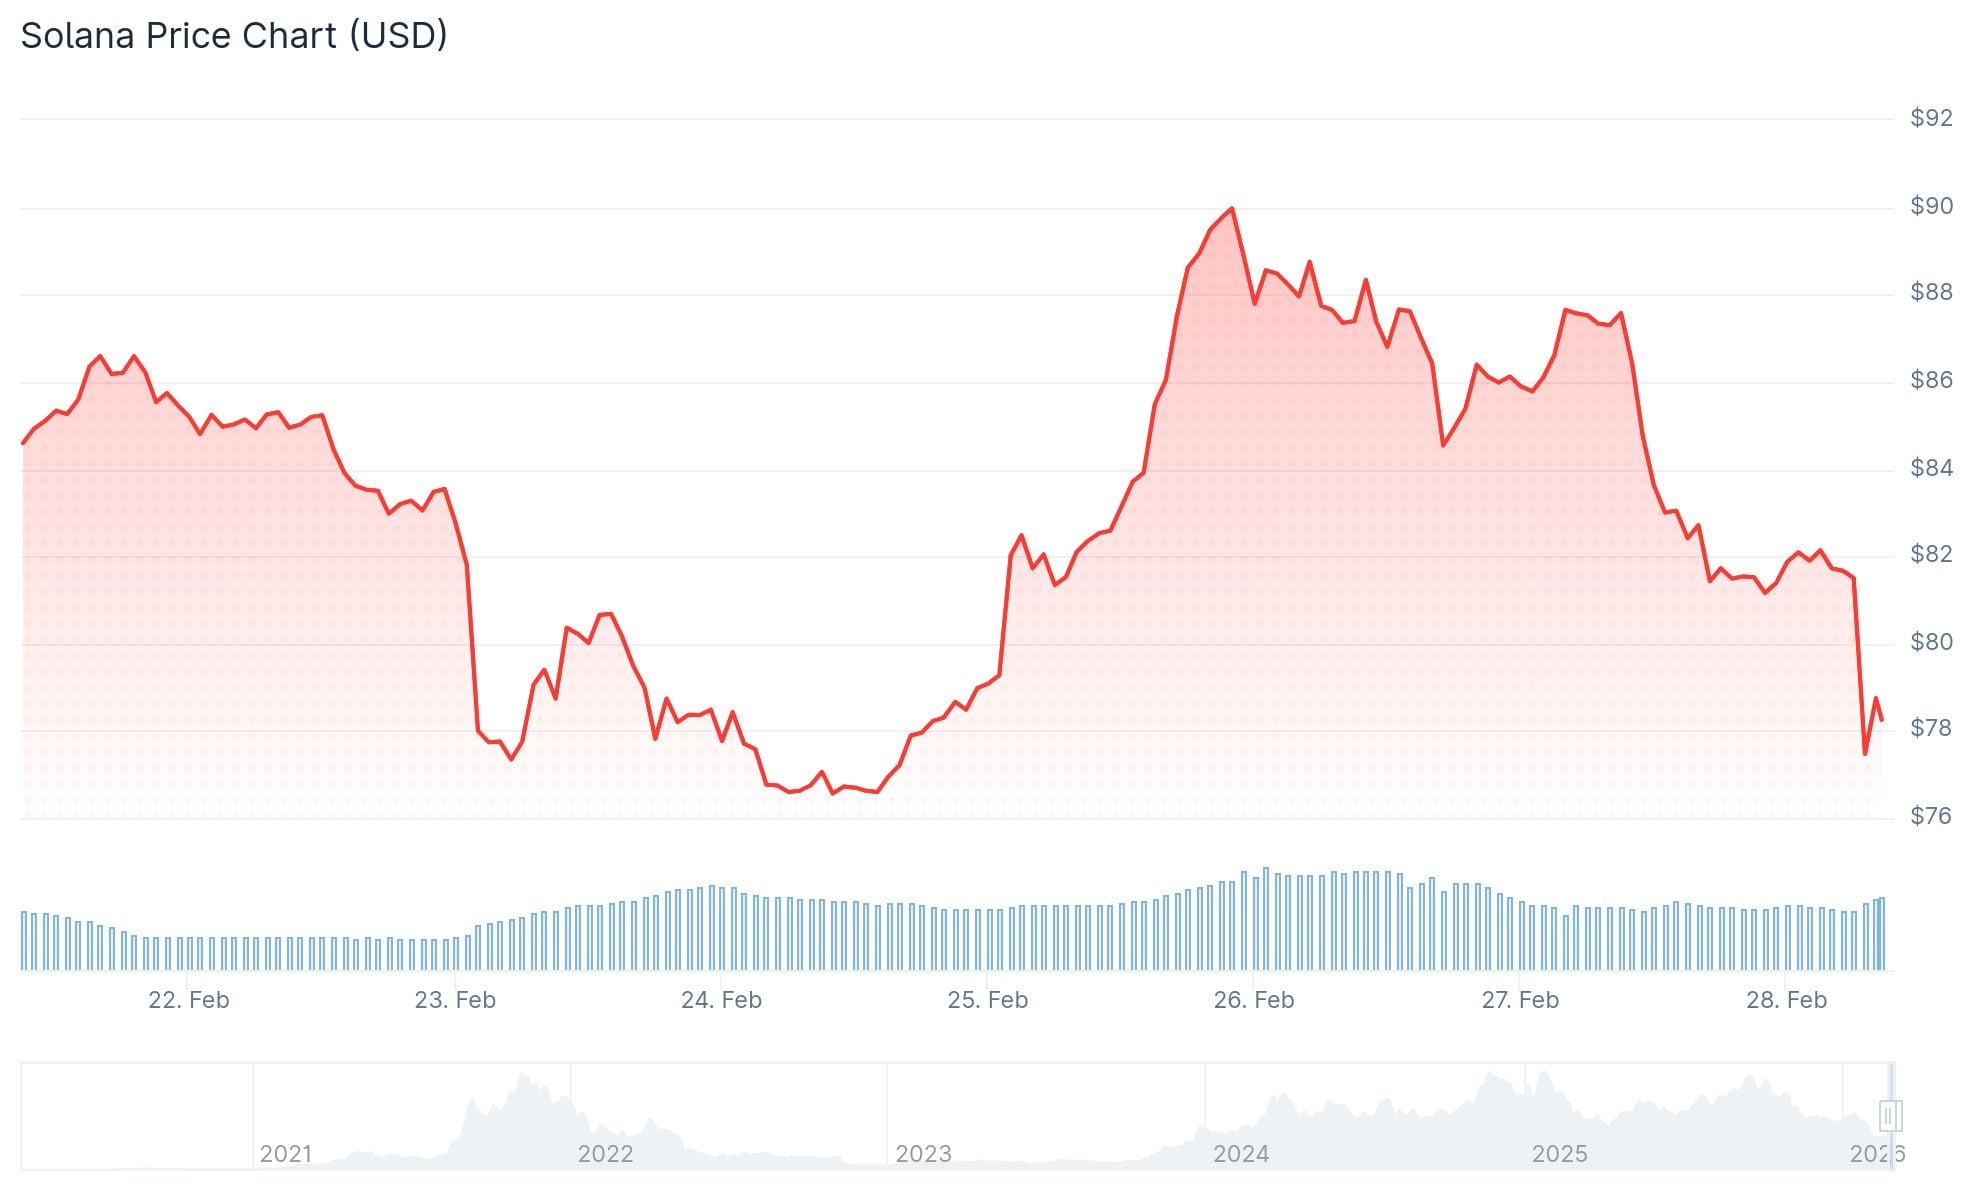
- Solana’s price sits at $78, representing a 72% decline from the $295 all-time high recorded previously
- SOL ETF products have experienced only $11.3M in total outflows, significantly less than the sustained negative flows seen in Bitcoin and Ethereum ETF products over four months
- DEX trading volume on Solana reached $108 billion across the last 30 days, surpassing Ethereum’s $63.7 billion
- Technical analysts have identified critical support zones at $50, $22, and $10 using Parallel Channel analysis
- Escalating tensions between Israel and Iran sparked widespread selling across cryptocurrency markets, driving Bitcoin toward $60,000 and weighing on alternative tokens including SOL
The Solana ecosystem’s native token is changing hands at $78, marking a severe 72% retracement from its peak valuation of $295. This decline unfolds against a backdrop of widespread cryptocurrency weakness, with escalating geopolitical concerns intensifying selling pressure on February 28, 2026.
Military action commenced as Israel executed strikes targeting Iranian positions during Saturday morning hours in local time zones. U.S. forces participated in the operation, according to sources cited by the Associated Press. Bitcoin experienced a sharp 5% decline within minutes, approaching the $60,000 threshold, while alternative cryptocurrencies like SOL absorbed significant selling pressure.
Network fundamentals for Solana continue demonstrating resilience despite price weakness. DEX transaction volume across the Solana blockchain totaled $108 billion throughout the previous 30-day period, eclipsing Ethereum’s $63.7 billion and Base’s $31.48 billion.
Application revenue generated on Solana over the most recent 24-hour period reached $3.1 million, marginally exceeding Ethereum’s $2.95 million. The count of active addresses on Solana registered 2.17 million, substantially higher than Ethereum’s 682,236.
The real-world asset tokenization segment on Solana has achieved a record valuation of $1.71 billion, marking a 45% expansion over the past month.

SOL ETF Flows Hold Steady
Spot Solana ETF products entered the market during late October 2025, attracting more than $100 million in average net inflows throughout their initial five-week trading period. Weekly capital inflows have moderated to the $20–$25 million range as prices retreated.
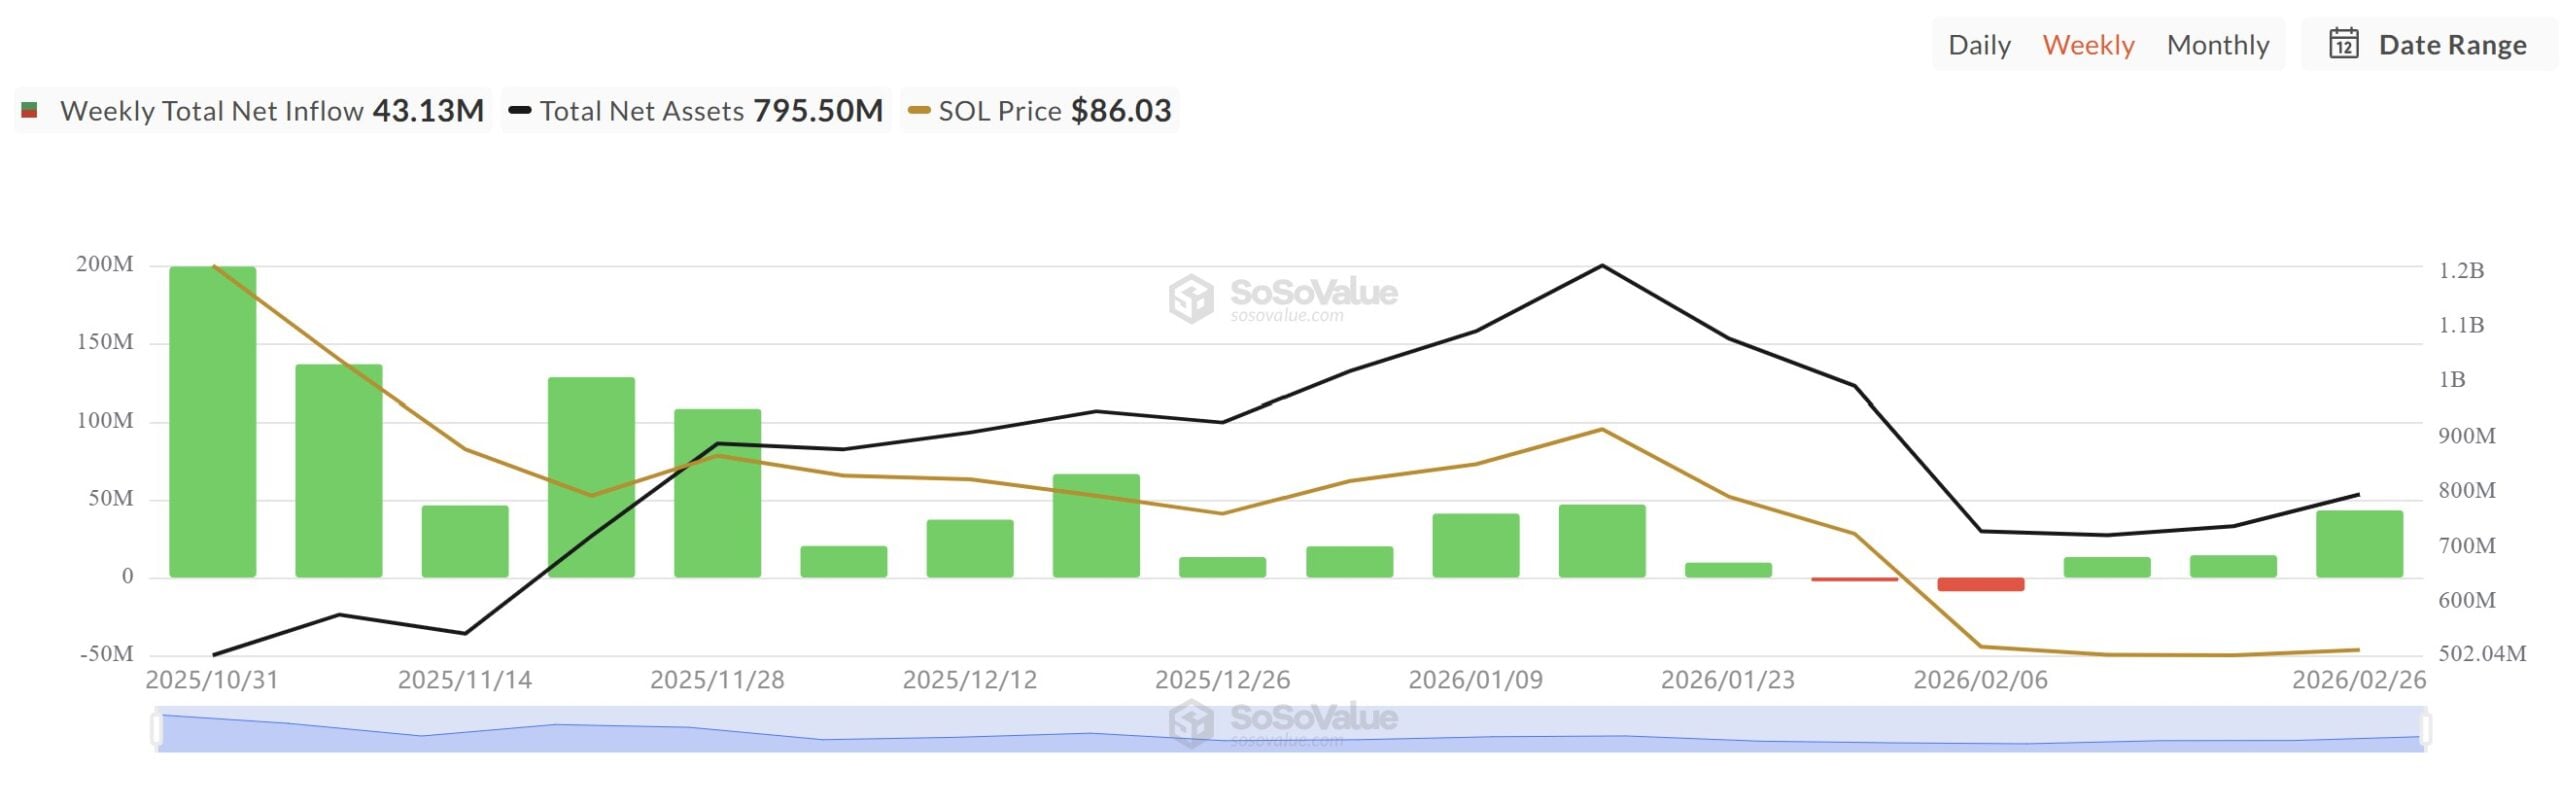
Aggregate outflows during the four-month price decline amount to merely $11.3 million across a two-week span. Bitcoin and Ethereum ETF products, in comparison, recorded four consecutive months of net negative flows during the identical timeframe.
Solana is presently trading substantially beneath the $188 level observed when ETF products initially launched.
Key Support Levels to Watch
Technical analyst Ali Martinez highlighted a developing Parallel Channel structure visible on SOL’s weekly timeframe chart. This pattern suggests potential support zones positioned at $50.22, $22.47, and $9.98.
Crypto analyst Scient identified two supplementary zones warranting attention. The initial area corresponds to the 0.75 Fibonacci retracement spanning $60 to $70. The secondary zone represents a weekly demand fair value gap situated between $22 and $29.
UTXO analysis data provided by Glassnode reveals that over 6% of circulating SOL supply last changed hands within the present price range. The subsequent significant supply concentration, exceeding 3%, resides between $20 and $30.
SOL currently trades beneath the weekly resistance threshold of $120. The $51 to $80 range on weekly charts has undergone testing and corresponds with retracement areas under analyst scrutiny.
As of February 28, 2026, SOL was valued at $78 while markets processed developments surrounding the Israel-Iran military engagement.
Get 3 Free Stock Ebooks
Discover top-performing stocks in AI, Crypto, and Technology with expert analysis.
- Top 10 AI Stocks - Leading AI companies
- Top 10 Crypto Stocks - Blockchain leaders
- Top 10 Tech Stocks - Tech giants

