
 Accumulates $136M in Inflows Despite Technical Warning Signs")
Key Takeaways
- Cryptocurrency investment products attracted $230M last week, with Bitcoin capturing $219M
- SOL logged $17M in weekly inflows, extending its positive streak to seven weeks for a cumulative $136M
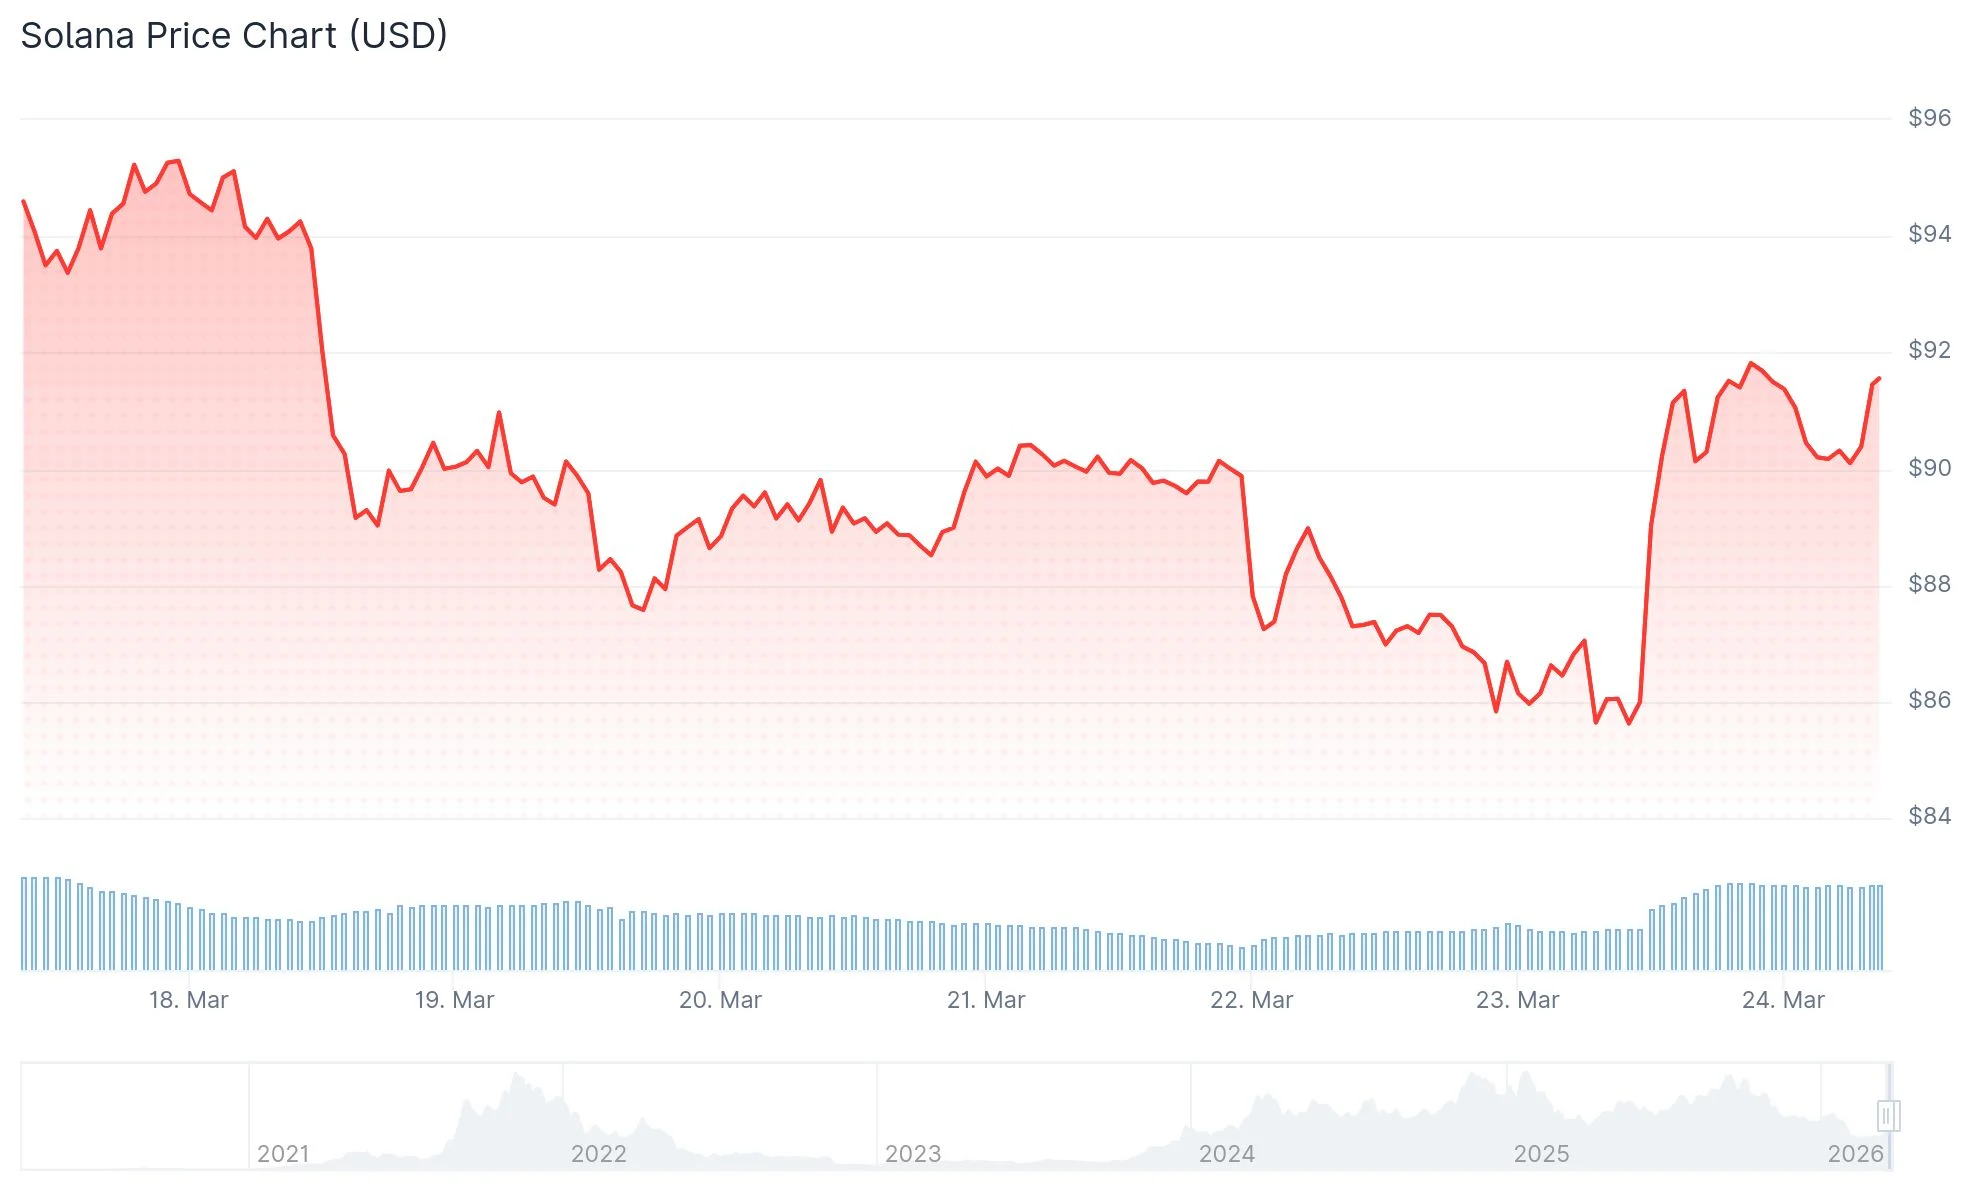
- Current trading range sits at $91–92, showing 5.64% daily gains but a 3% weekly decline
- Technical analysis reveals a rising wedge formation suggesting continued bearish pressure
- Critical price zones include $78 support level and $95 resistance, with downside targets at $65–70
Solana (SOL) currently hovers in the lower $90 range following a slight rebound, though technical indicators cast doubt on the sustainability of this upward movement.
Cryptocurrency investment vehicles recorded $230M in aggregate inflows during the previous week, per CoinShares research. Initial momentum showed $635M entering markets early in the week, before the Federal Reserve’s policy announcement triggered a reversal that resulted in $405M leaving mid-week.
Geographically, the United States dominated with $153M in contributions. German investors added $30.2M while Swiss participants brought in $27.5M.
Bitcoin dominated capital allocation with $219M in net inflows. Ethereum experienced $27.5M in withdrawals, ending a three-week run of positive flows.
Solana captured $17M during the week, marking its seventh uninterrupted week of positive flows. This extended streak has accumulated to $136M in total inflows.

At press time, SOL traded at $91.61, representing a 5.64% increase over 24 hours. However, the seven-day performance shows a roughly 3% decline despite the recent bounce.
Technical Pattern Signals Caution
Market analyst CryptoBullet identified a rising wedge structure developing on SOL’s 3-day timeframe. This formation emerged following Solana’s breakdown beneath its 200-week moving average, a critical indicator for assessing long-term directional bias.
Successive rallies within the wedge structure display diminishing strength with each attempt. This pattern indicates that bullish participants are losing conviction and momentum. Rising wedges that form after significant price declines typically foreshadow continuation of the downtrend.
Should SOL violate the lower boundary of the wedge, a more pronounced decline may materialize. Market analyst DrBullZeus identifies $78 as the next meaningful support level, with a breach potentially driving prices toward the $65–70 region.
Weekly Timeframe Presents Contradictory Indicators
Examining the weekly chart reveals that the 100 and 200-period exponential moving averages maintain upward trajectories, offering some long-term encouragement. Conversely, the 20 and 50-period EMAs have leveled off, indicating momentum is stalling.
Bollinger Bands display narrow compression, a configuration that historically precedes significant volatility in either direction. The Relative Strength Index registers in the mid-30s — not yet oversold territory, but clearly demonstrating seller dominance.
The MACD indicator continues operating in negative territory, though diminishing histogram bars suggest distribution pressure may be gradually weakening.
Chainlink and Hyperliquid also registered modest inflows of $4.6M and $4.5M respectively during the reporting period.
For the bullish scenario, clearing resistance at $95 could propel SOL toward the $110–$120 range. Extended-term forecasts from analyst Moonbag suggest potential appreciation to $260–$300 if SOL successfully recaptures the $180–$200 territory.
The Balance of Power metric currently reads negative, confirming that sellers maintain control according to the most recent data points.
Get 3 Free Stock Ebooks
Discover top-performing stocks in AI, Crypto, and Technology with expert analysis.
- Top 10 AI Stocks - Leading AI companies
- Top 10 Crypto Stocks - Blockchain leaders
- Top 10 Tech Stocks - Tech giants

