
 April Analysis: Charts and On-Chain Metrics Signal Mounting Pressure")
Key Takeaways
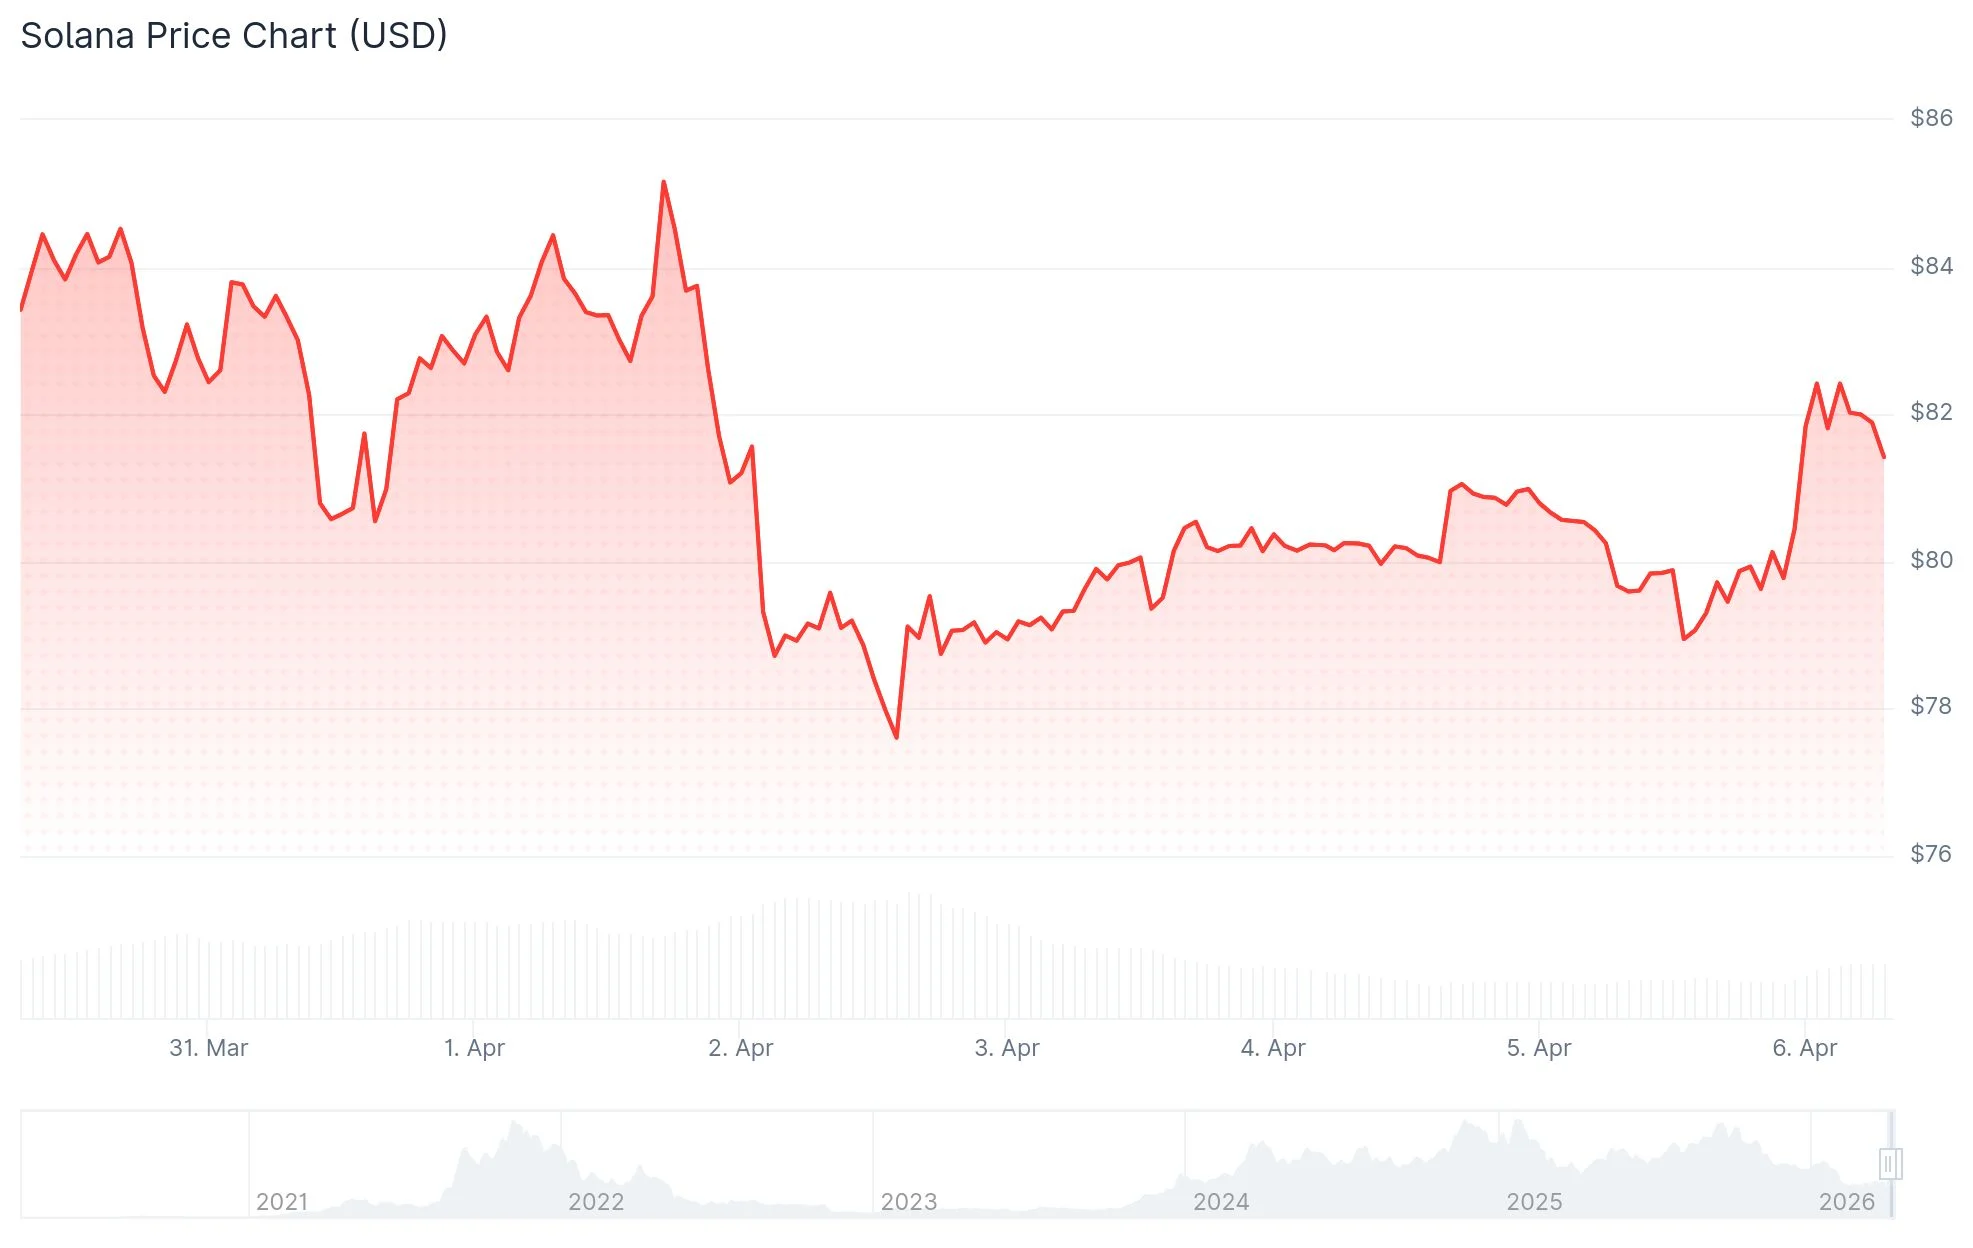
- SOL price hovers between $78–$82, attempting to maintain crucial support in the $75–$78 range
- The Drift Protocol suffered a devastating $285 million security breach affecting network sentiment
- Total value locked on Solana has contracted from $9 billion to approximately $5.5–$6 billion recently
- Over 1.40 million SOL tokens (valued at roughly $110 million) transferred to centralized exchanges within three days
- Institutional money flows show $5.24 million in net SOL ETF withdrawals for consecutive weeks
The Solana network faces mounting challenges following a cascade of adverse events impacting its ecosystem. At press time, SOL has retreated approximately 1.5%, currently changing hands in the $78 to $82 corridor.
The primary catalyst behind this downturn stems from the April 1, 2026 security compromise of Drift Protocol—a decentralized finance platform operating on Solana—resulting in $285 million in losses. Cybersecurity investigators attributed the breach to threat actors from North Korea. Following the incident, Drift’s TVL plummeted from $530 million to merely $230 million within hours.
This exploit has sent ripples throughout Solana’s DeFi landscape. Market participants are now conducting thorough risk assessments of applications deployed across the blockchain.
Network Value Locked Suggests Capital Flight
According to metrics from DeFiLlama, Solana’s aggregate TVL has contracted from peaks above $9 billion down to the $5.5–$6 billion range in the past several weeks. This magnitude of reduction indicates genuine capital withdrawal rather than mere valuation changes.
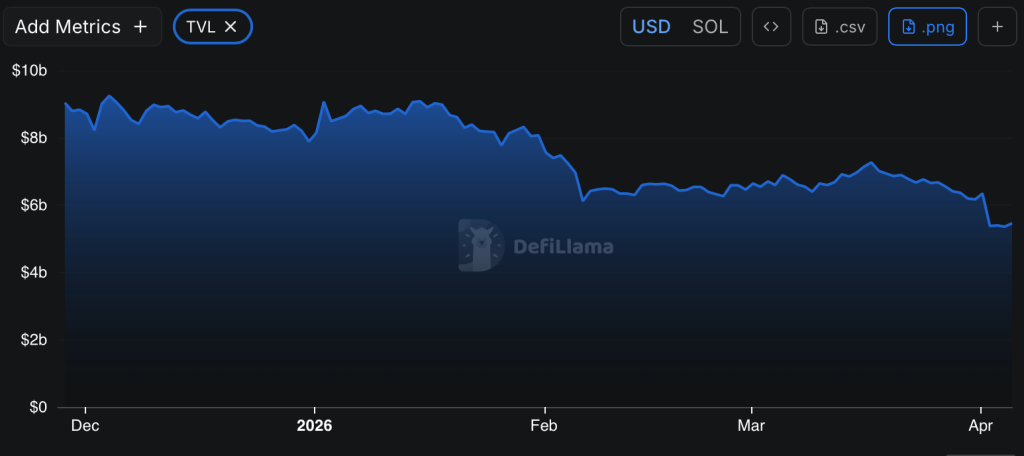
Decreasing TVL suggests reduced user participation in protocol staking and liquidity provision. This environment creates barriers for attracting fresh capital, as investor sentiment remains cautious.

Blockchain analytics from Glassnode, highlighted by market observer Ali Charts, reveals that 1.40 million SOL—approximately $110 million in value—migrated to exchange wallets during a 72-hour period. Exchange-held balances increased from 26.5 million SOL on March 31 to 28.6 million by April 2. While elevated exchange reserves can indicate preparation for distribution, this metric alone doesn’t guarantee imminent selling pressure.
Critical Price Zones Under Surveillance
Solana presently finds itself testing a pivotal support band spanning $75 through $78. While this zone has previously triggered rebounds, consecutive retests without decisive buying action gradually erode support integrity.
The Relative Strength Index registers near 44, positioned below neutral territory, while the MACD indicator persists in negative space. These technical readings indicate momentum deficiency. The 50-day exponential moving average stands at $88.80, representing the initial resistance threshold SOL must overcome to signal potential trend reversal.
Market analyst Crypto Patel presented a long-term technical framework illustrating SOL positioned near Fibonacci support spanning $61.75 to $42.62. The analysis identifies a potential accumulation window if current levels hold, referencing Solana’s previous 2,194% advance from 2022 bottoms. However, Crypto Patel emphasized that the chart’s $1,000+ long-term projection represents a theoretical target rather than an assured outcome.
Institutional investment vehicle data from Sosovalue documents $5.24 million in net weekly SOL ETF outflows, representing the second consecutive week of withdrawals. Near-term institutional appetite remains subdued.
Get 3 Free Stock Ebooks
Discover top-performing stocks in AI, Crypto, and Technology with expert analysis.
- Top 10 AI Stocks - Leading AI companies
- Top 10 Crypto Stocks - Blockchain leaders
- Top 10 Tech Stocks - Tech giants

