
 Consolidates Near $85: Will the Four-Week Range Finally Break?")
TLDR
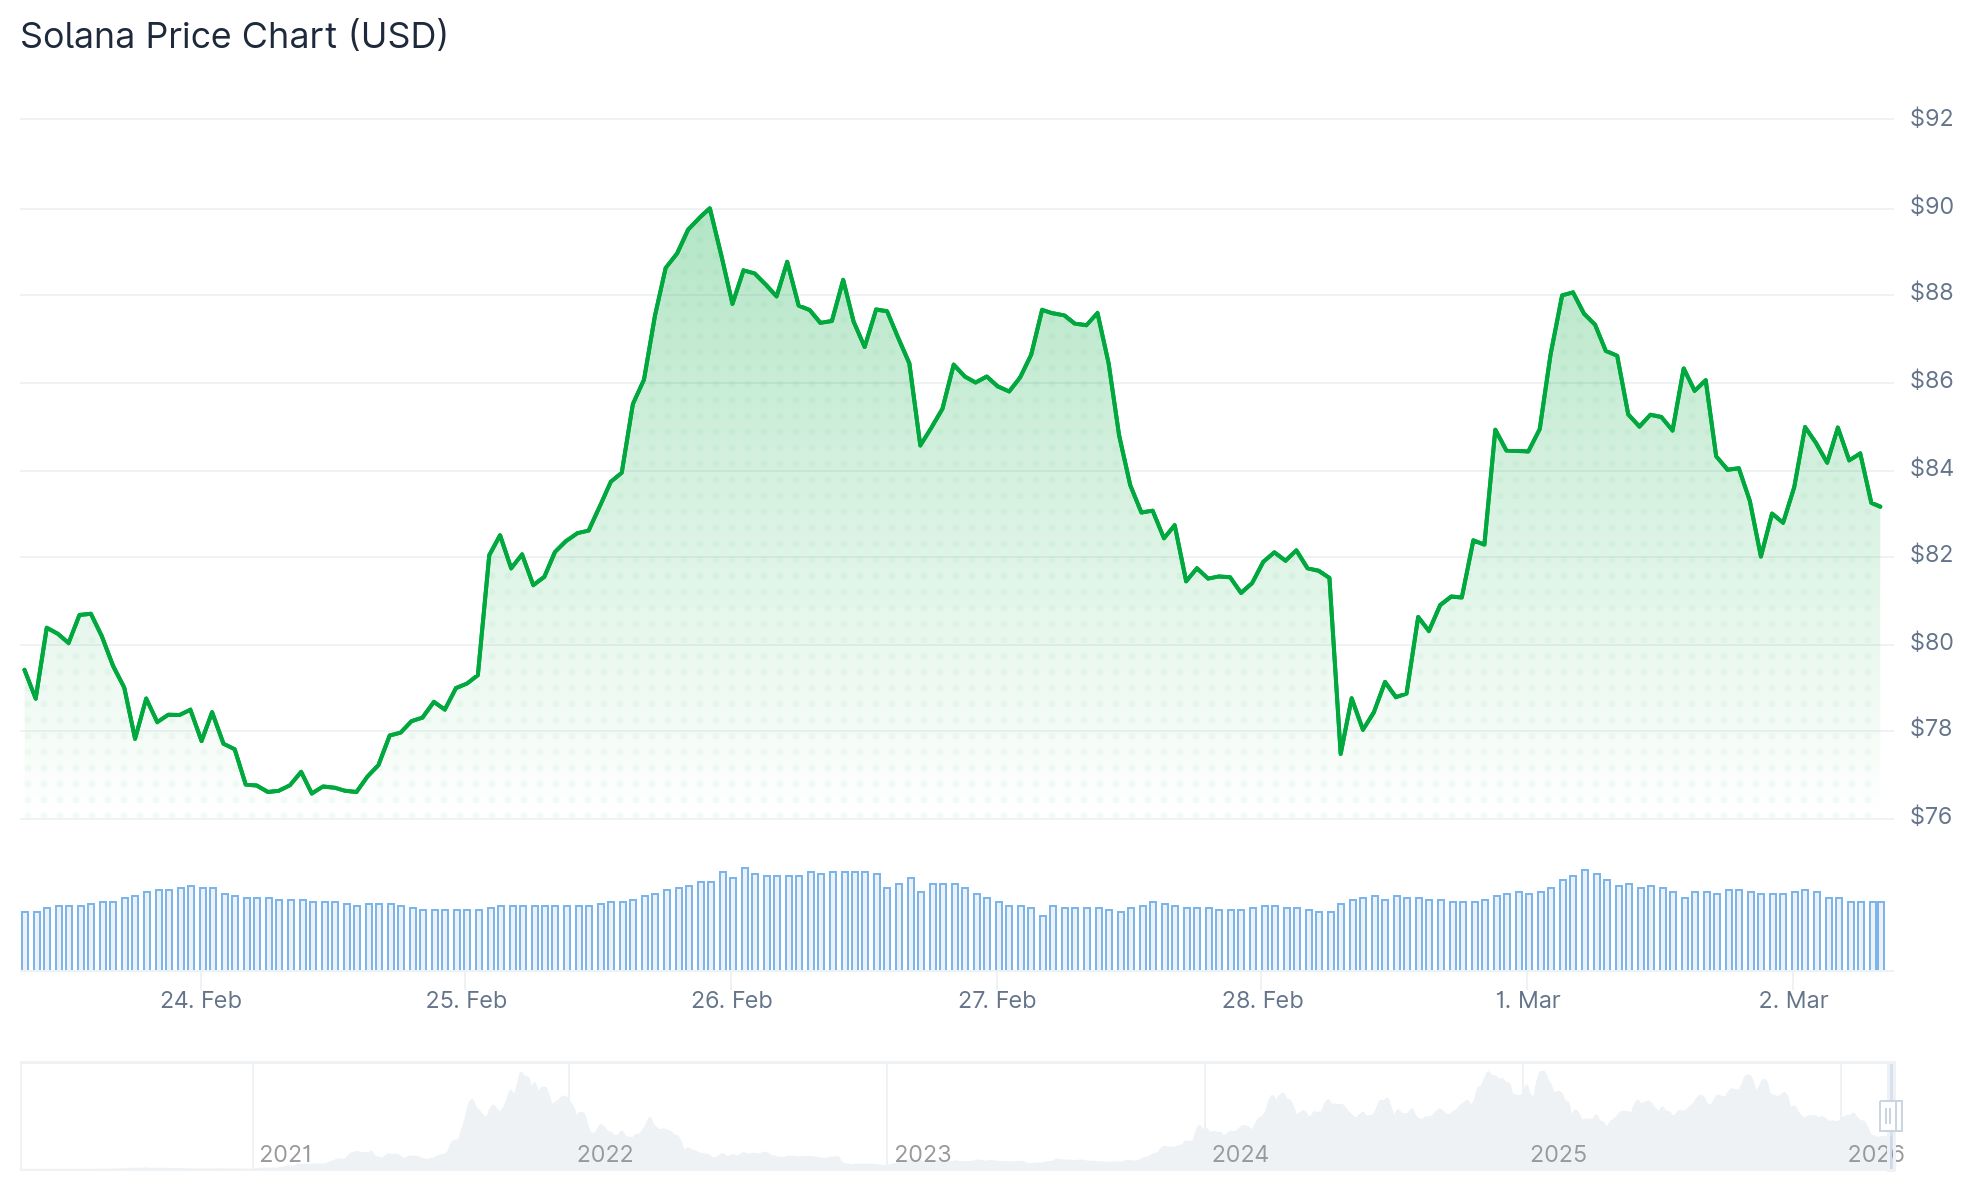
- SOL has remained confined within a narrow $77–$88 trading corridor for almost a month without establishing clear directional momentum
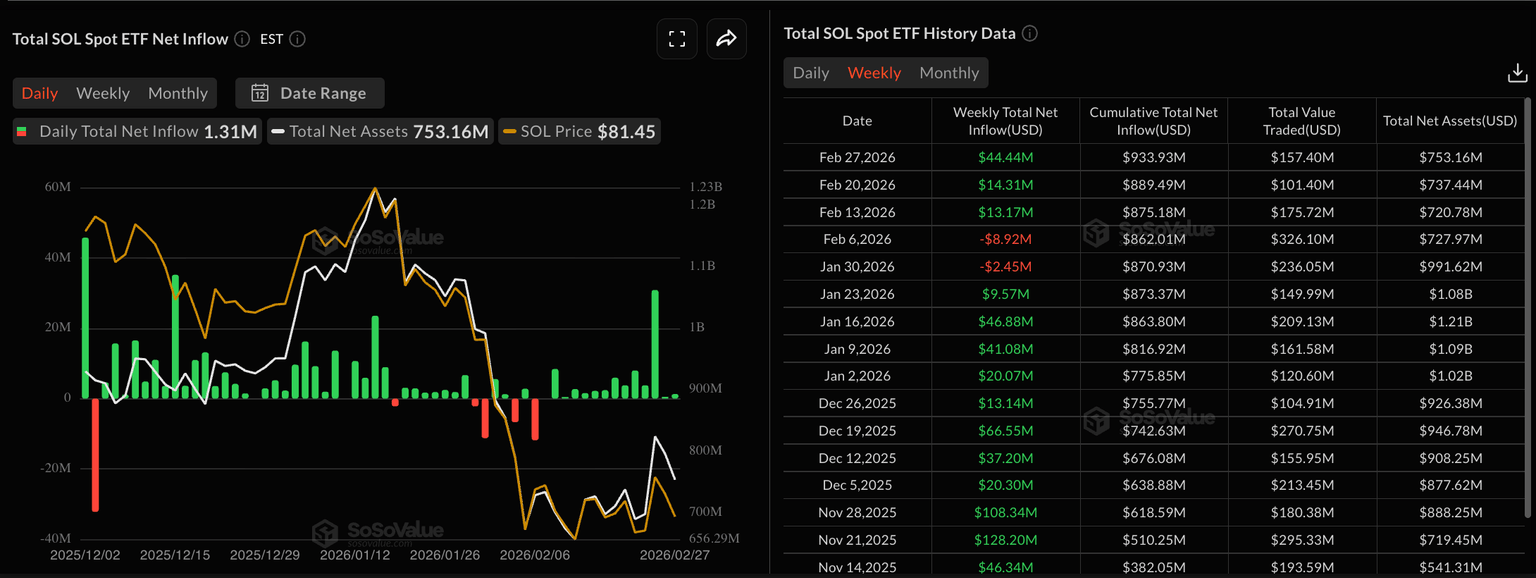
- Spot Solana ETFs in the United States attracted more than $44 million in net inflows last week, pushing total inflows beyond $900 million
- Futures Open Interest for SOL declined more than 6% within a 24-hour period, accompanied by $26.47 million in liquidations dominated by long positions
- Technical indicators show Bollinger Bands tightening, suggesting an imminent volatility expansion in either direction
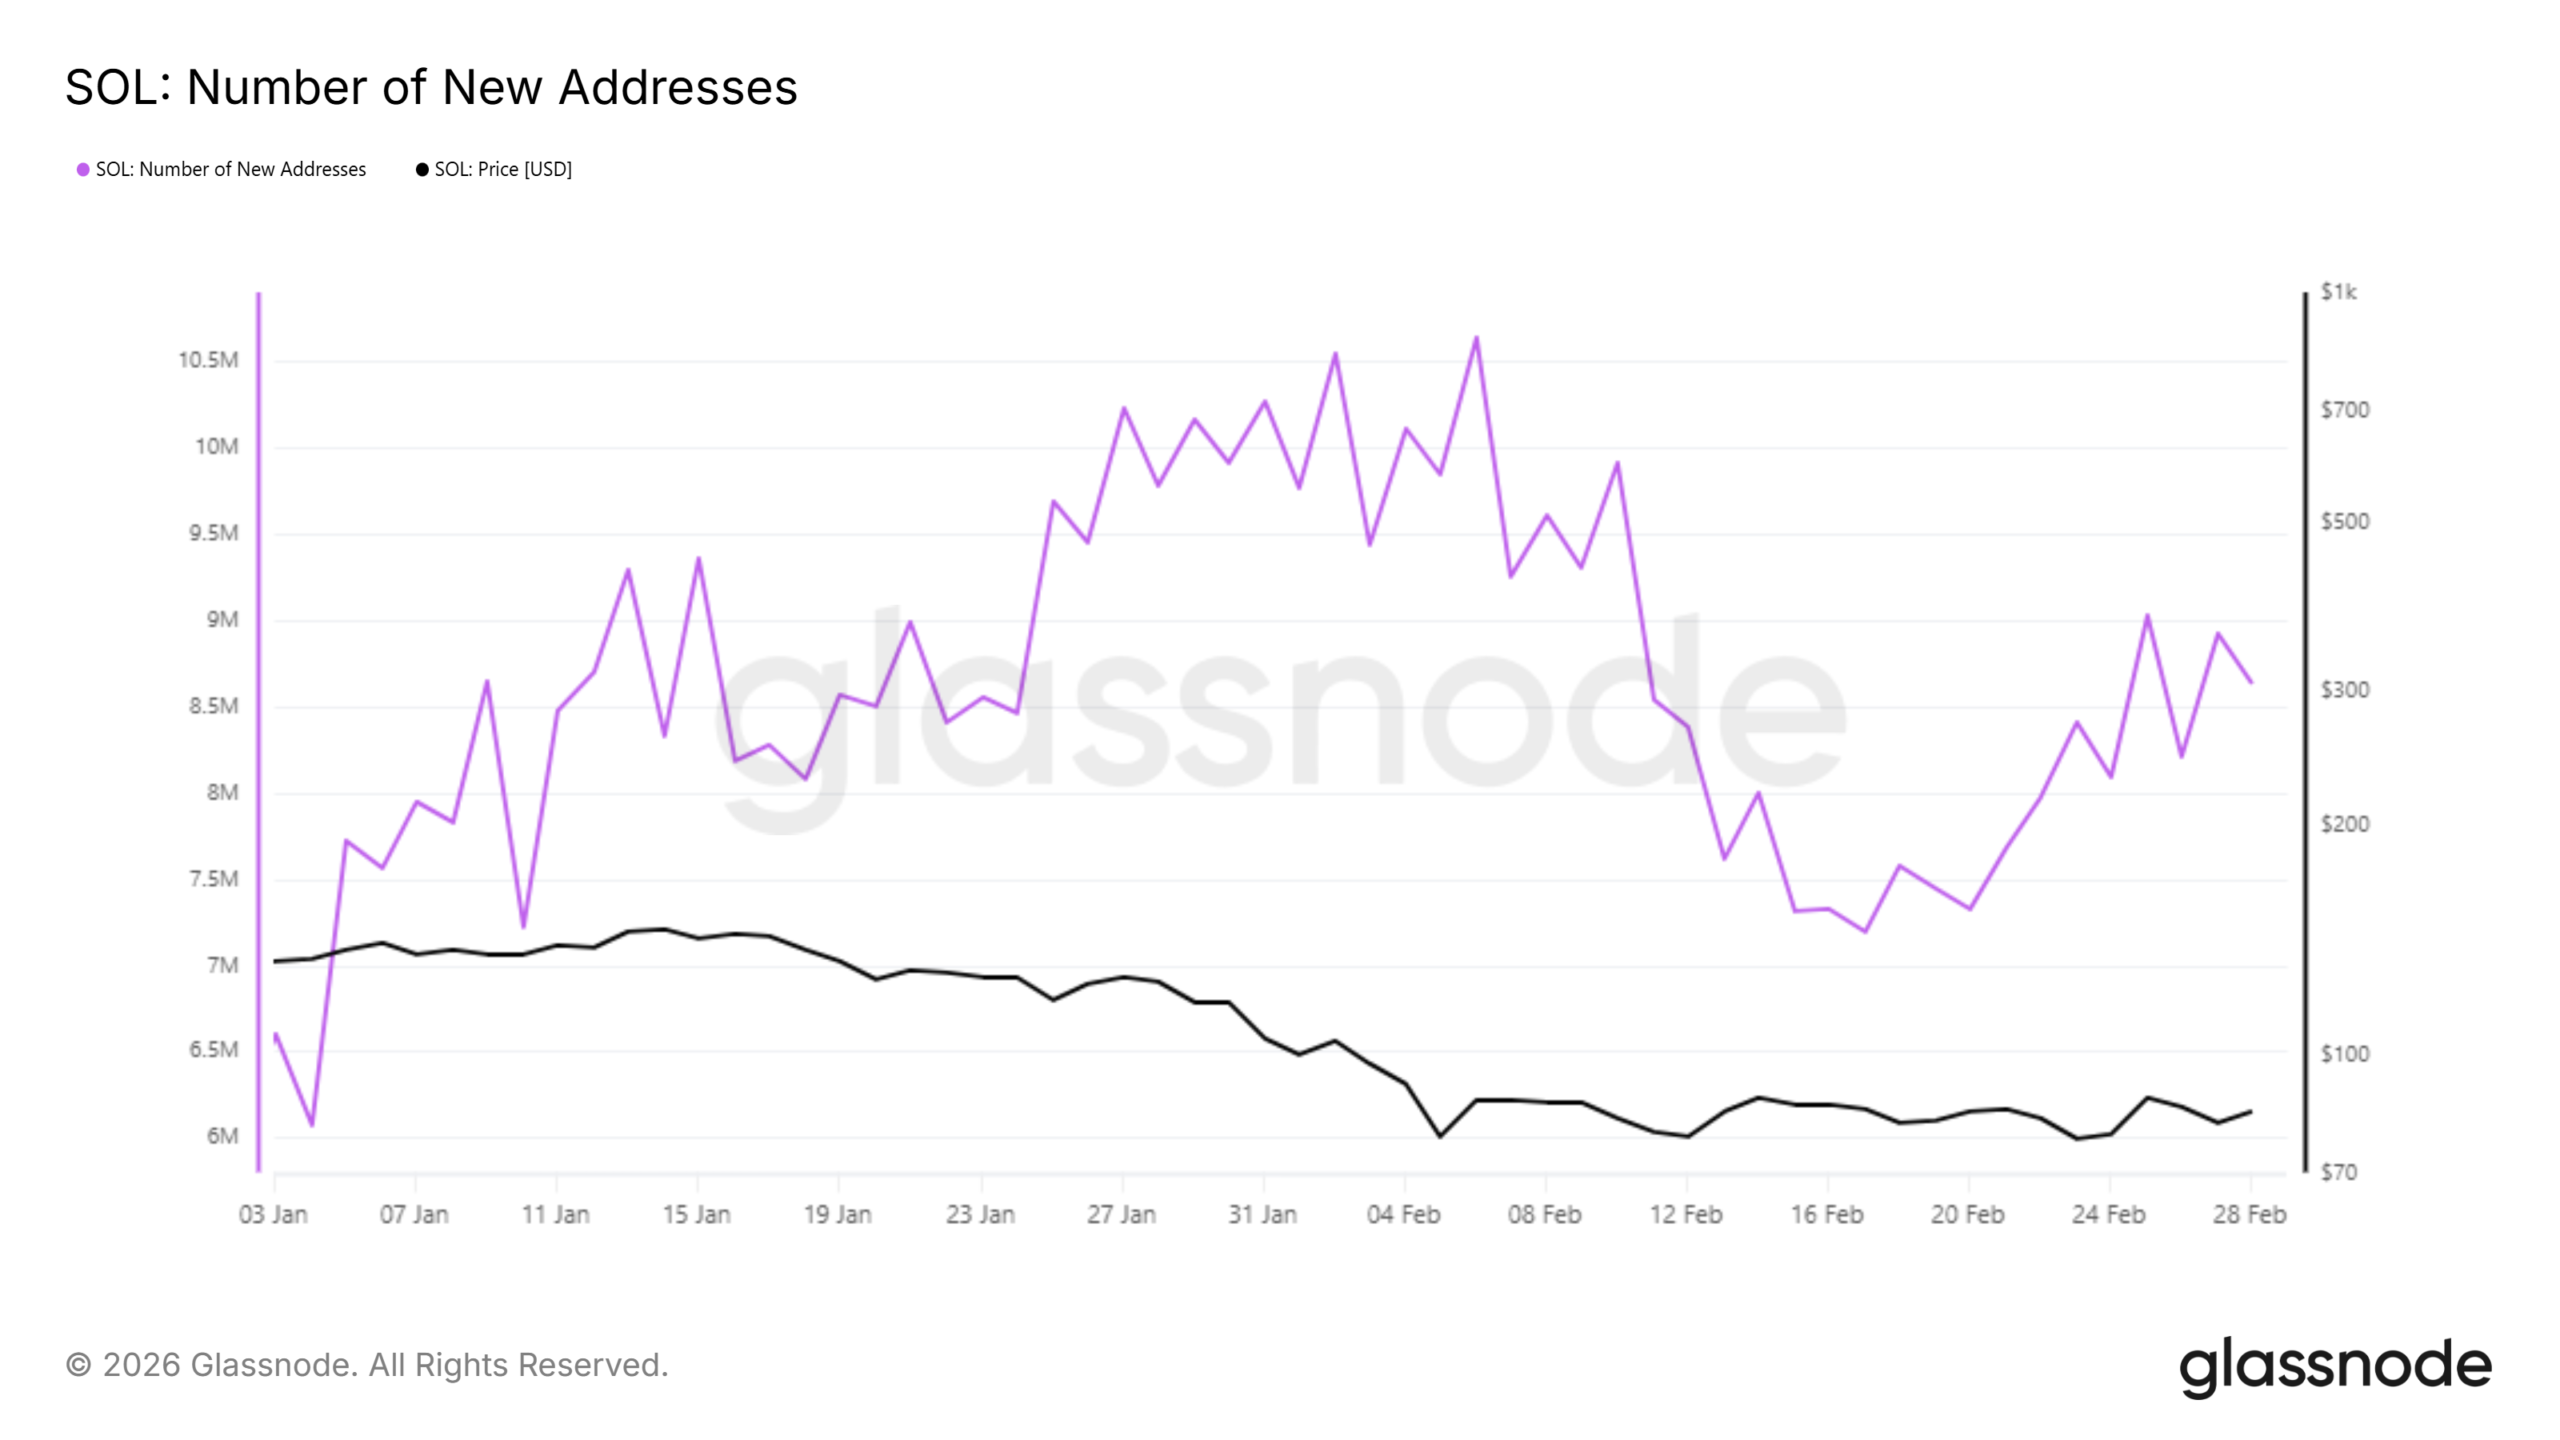
- New daily addresses on the Solana network increased by 1.4 million across 12 days, hitting 8.6 million and indicating sustained network expansion
As of March 2, 2026, Solana (SOL) continues to hover around the $84–$85 mark, remaining trapped within a consolidation pattern that has persisted for nearly a full month. The digital asset has repeatedly tested support near $77 and resistance around $88 without establishing a clear breakout in either direction.
While price action remains muted, institutional appetite shows no signs of waning. Last week alone, spot Solana exchange-traded funds in the United States pulled in $44.44 million in net inflows, with Wednesday accounting for a substantial $30.86 million of that figure.
Year-to-date cumulative inflows into these ETF products have now crossed the $900 million threshold. Throughout February, the funds registered net positive flows for over 12 straight days, contrasting sharply with simultaneous outflows observed in Bitcoin and Ethereum ETF counterparts.
Retail trader positioning presents a contrasting picture. Open Interest in SOL futures contracts declined by more than 6% over a 24-hour span, falling to $4.89 billion as participants unwound their positions.
Liquidations totaled $26.47 million during this period, with long positions accounting for $20.47 million of the total. This indicates a widespread clearing of bullish speculative bets.

Despite the liquidation cascade, funding rates remain positive between 0.0037–0.0041%, suggesting that leveraged traders continue to maintain a bullish bias and are willing to pay a premium for long exposure.
Key Technical Levels
SOL continues trading beneath both its 50-day and 200-day Exponential Moving Averages, which currently sit at $99.06 and $137.23 respectively. These moving averages are serving as significant resistance zones.
The Relative Strength Index is positioned around 43, beneath the neutral 50 threshold. Meanwhile, the MACD histogram indicates diminishing bearish pressure but has not yet generated a bullish crossover signal.
Bollinger Bands on the daily timeframe are narrowing substantially. This type of compression typically precedes a significant price movement, although the breakout direction remains uncertain at this stage.
Crypto analyst Umair highlighted a divergence between SOL’s performance against USDT versus BTC. While the USDT pair displays a pattern of declining highs, the BTC pair shows ascending highs — a divergence that has persisted for 24 days.
On-Chain Data Shows Network Growth
Blockchain analytics from Glassnode reveal that daily new Solana addresses climbed by 1.4 million during the previous 12-day period, bringing the cumulative count to 8.6 million. This metric points to continued expansion in user adoption across the network.
Long-term token holders remain in profitable territory overall, although the rate of accumulation has moderated. Data tracking hodler net position changes indicates resilience in conviction but a slowdown in fresh buying activity.
Should SOL successfully breach the $88 resistance and subsequently clear $93.43, the next logical upside target would be the 50-day EMA near $99. A sustained close above that level could open the pathway toward the $137 region.
Conversely, if the price fails to hold $77 support, the next downside level to watch sits at $67.50, which corresponds to the February 6 low.
Trading volume for SOL decreased by 5.77% to $12.20 billion, while Open Interest also contracted by 3.73% to $4.88 billion according to the most recent data available.
Get 3 Free Stock Ebooks
Discover top-performing stocks in AI, Crypto, and Technology with expert analysis.
- Top 10 AI Stocks - Leading AI companies
- Top 10 Crypto Stocks - Blockchain leaders
- Top 10 Tech Stocks - Tech giants

