
 Eyes 30% Surge if Key $90 Support Level Holds Strong")
Key Takeaways
- Solana currently trades around $89–$90, with buyers actively defending this critical support zone.
- Breaking decisively above $90 may propel prices toward $120, representing approximately 30% upside potential.
- Monthly trading volumes surged 30%, momentarily reaching nearly $5 billion in activity.
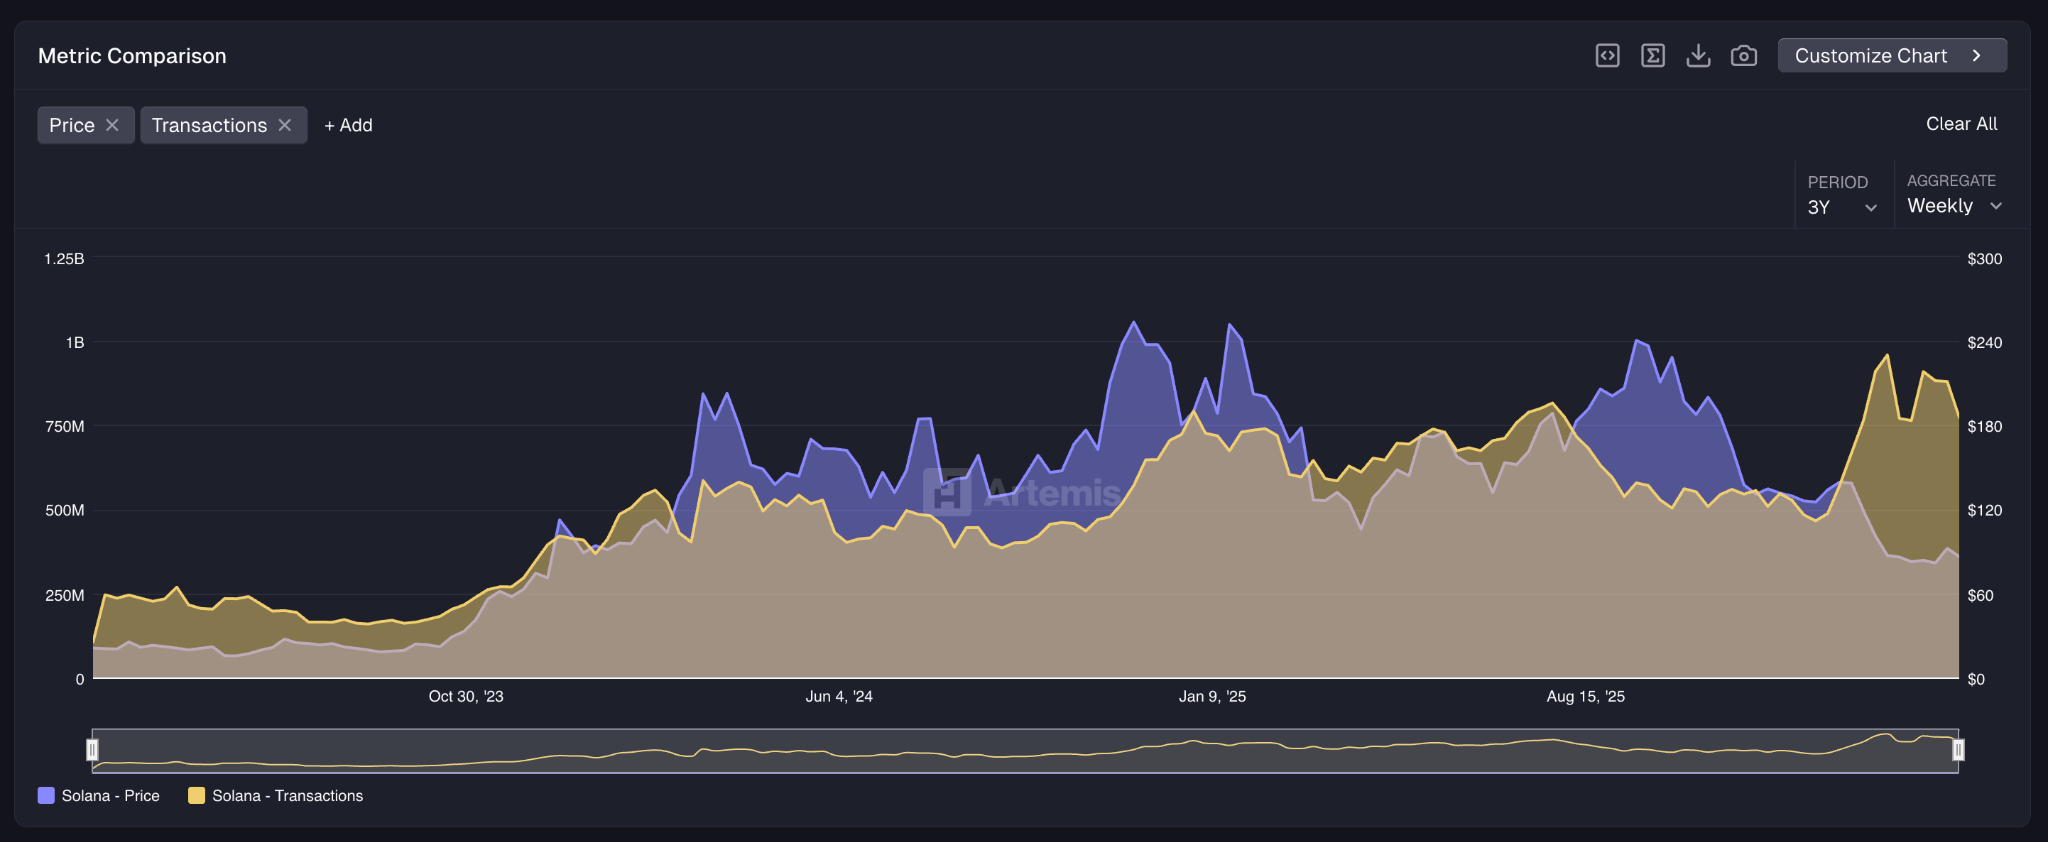
- Network transaction counts declined 20% from recent highs, indicating reduced on-chain engagement.
- Technical analyst Crypto Patel identifies a monthly bullish engulfing pattern as the crucial indicator for an extended rally.
Solana continues to maintain its position around the $90 threshold as market participants engage in a tug-of-war at this pivotal price point. The upcoming trading sessions will likely determine whether SOL breaks higher or retreats toward lower support zones.
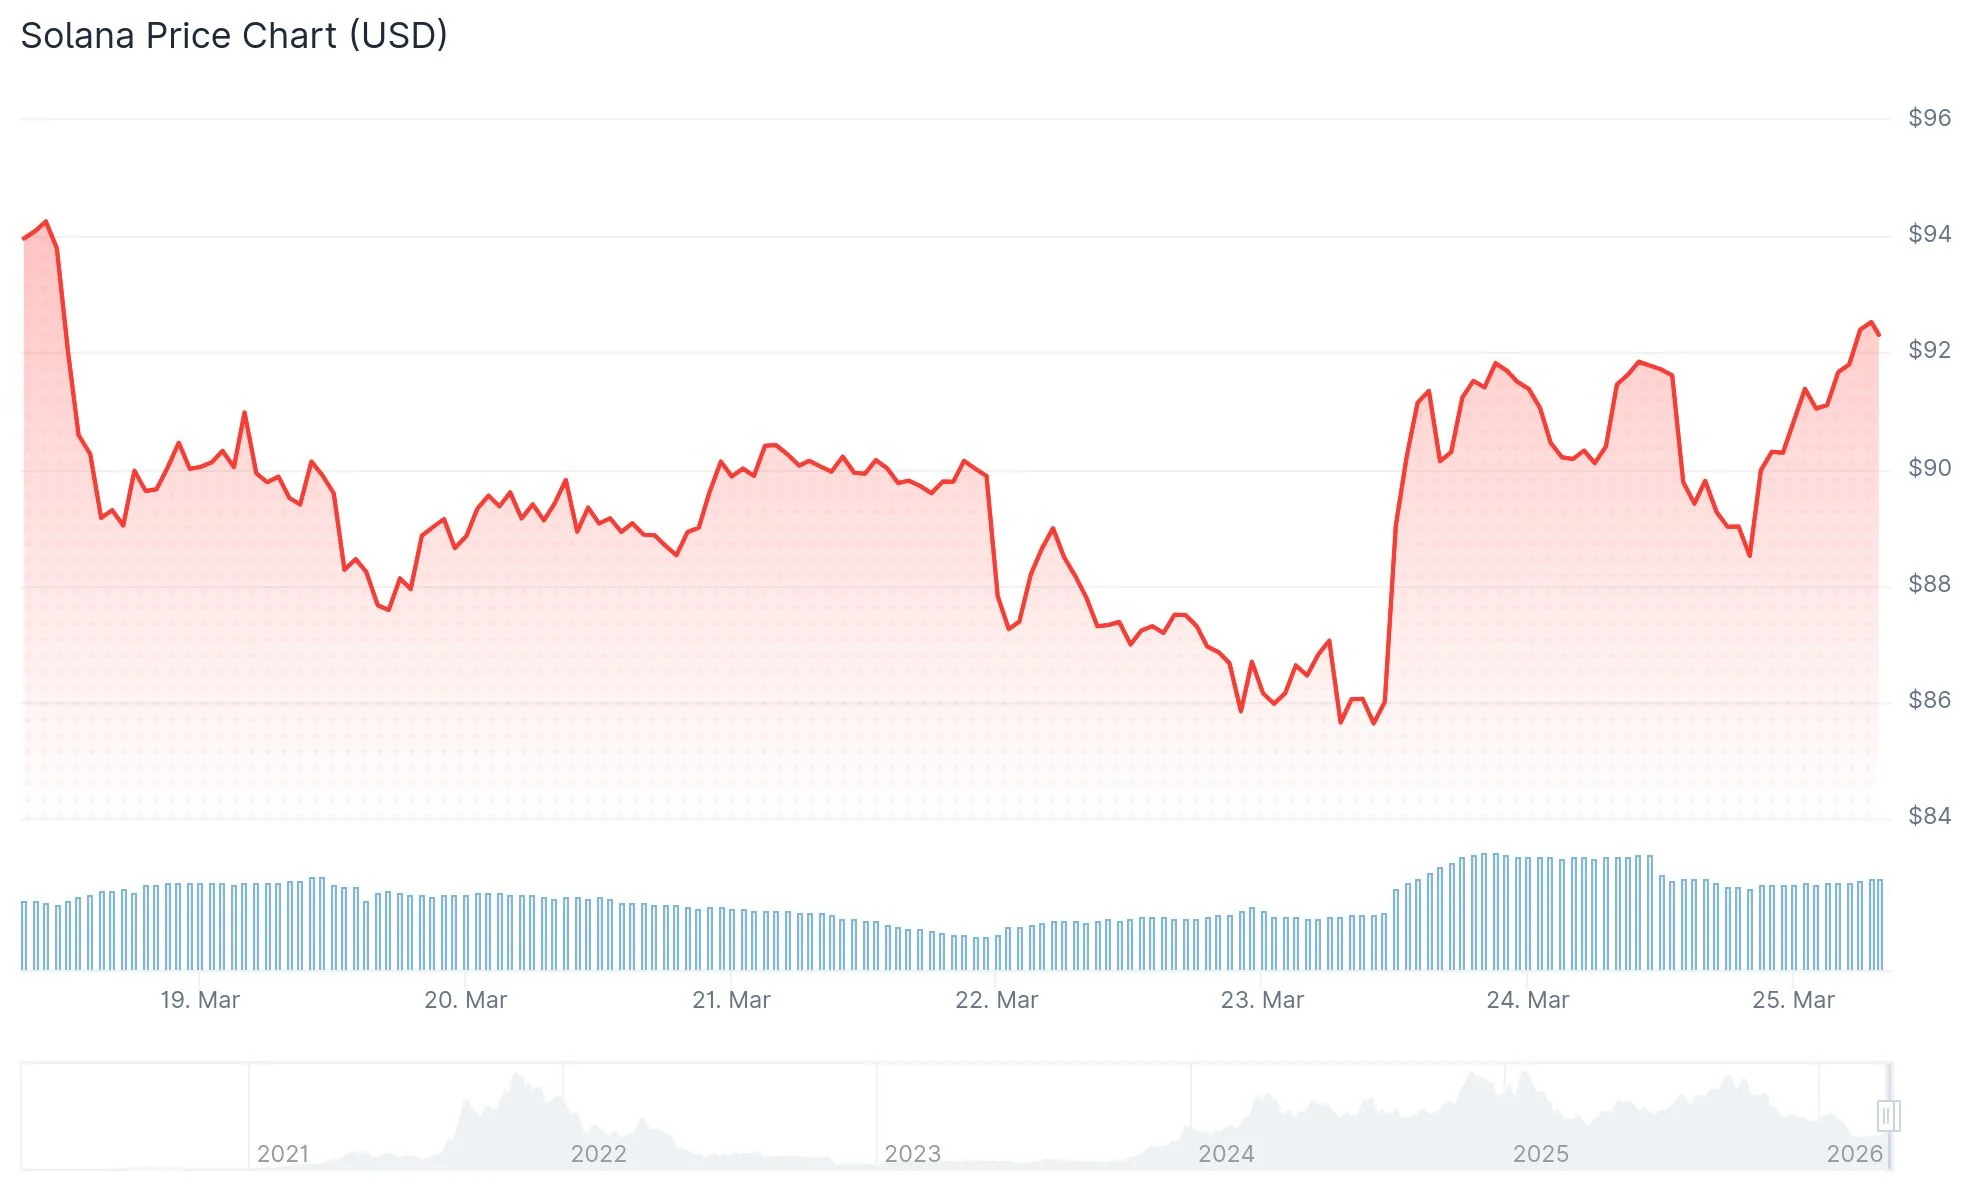
Over the last 30 days, SOL has registered approximately 7% gains and currently trades just beneath the $90 resistance area. Volume activity expanded by 30% throughout this timeframe, peaking close to $5 billion—roughly equivalent to 10% of the token’s circulating supply valuation.
President Donald Trump’s decision to temporarily halt U.S. military operations targeting Iranian energy infrastructure provided a boost to cryptocurrency markets earlier in the week. This development momentarily propelled SOL beyond $90, though sustained selling interest has prevented the asset from consolidating above that threshold.
Liquidation records indicate that more than $370 million in bearish positions were eliminated during that brief upward movement. Should buying momentum persist, a more substantial short squeeze scenario could materialize.
Daily chart analysis reveals the Relative Strength Index (RSI) positioned at 54, following a temporary climb above 60 last week. This positioning indicates developing positive momentum that hasn’t yet translated into a definitive breakout.

Critical Resistance and Support Zones
Should SOL successfully breach $90 with strong conviction, the immediate target becomes $100, representing an 11% advance. Sustained momentum beyond that milestone could drive prices toward $120, delivering a 30% return from present valuations.
Examining the 4-hour timeframe, a purchasing signal emerged precisely as SOL tested $90, indicating that institutional participants are entering positions at this price level. This behavior reinforces the technical significance of the $90 zone.
Conversely, if bearish pressure intensifies, SOL may decline toward $85 or potentially $80. The magnitude of any downward correction would depend on the force of selling momentum.
Network Metrics and Monthly Chart Analysis
Blockchain data from Artemis reveals that Solana processed 774 million transactions during the previous week. This figure represents a 20% reduction from the recent peak, suggesting diminished network utilization.
The Fear and Greed Index has rebounded from an extreme low of 5 to reach 46, demonstrating that market participants are transitioning away from panic conditions, although sentiment remains guarded.
Focusing on the monthly timeframe, technical analyst Crypto Patel has emphasized a noteworthy formation. He observes that every significant SOL rally has been preceded by a monthly bullish engulfing candle pattern.
Historical precedents include Solana surging from $1.03 to $260 during 2020 and climbing from $8 to $296 in 2022. According to Patel’s analysis, a comparable candle formation emerging in 2026 could potentially drive SOL toward $1,000 or higher.
Present technical readings present a mixed outlook. The monthly RSI registers 35.44, and SOL trades beneath all significant moving averages, including benchmarks at $104, $111, $152, and $160.
The MACD indicator stands at -1.26, positioned below the signal line at -20.88, accompanied by a negative histogram reading, pointing to ongoing near-term bearish pressure.
As of this writing, SOL is valued at $89.33, featuring 24-hour trading volume of $6.95 billion and commanding a market capitalization of $51.64 billion.
Get 3 Free Stock Ebooks
Discover top-performing stocks in AI, Crypto, and Technology with expert analysis.
- Top 10 AI Stocks - Leading AI companies
- Top 10 Crypto Stocks - Blockchain leaders
- Top 10 Tech Stocks - Tech giants

