
 Faces Mounting Pressure After $93 Resistance Rejection")
Key Takeaways
- SOL encountered resistance at $93 and declined 5.7% over 24 hours to approximately $87
- The token is positioned beneath its 20-, 50-, 100-, and 200-day moving averages
- Technical indicators (RSI, MACD) demonstrate limited bullish momentum
- A developing bearish flag formation suggests potential downside to the $40–$45 zone
- Despite price challenges, Solana handled 44% of worldwide cryptocurrency transactions
Solana (SOL) is experiencing selling pressure following an unsuccessful attempt to breach the $93 price barrier. The cryptocurrency has retreated and is currently hovering around a crucial support level that market participants are monitoring intently.
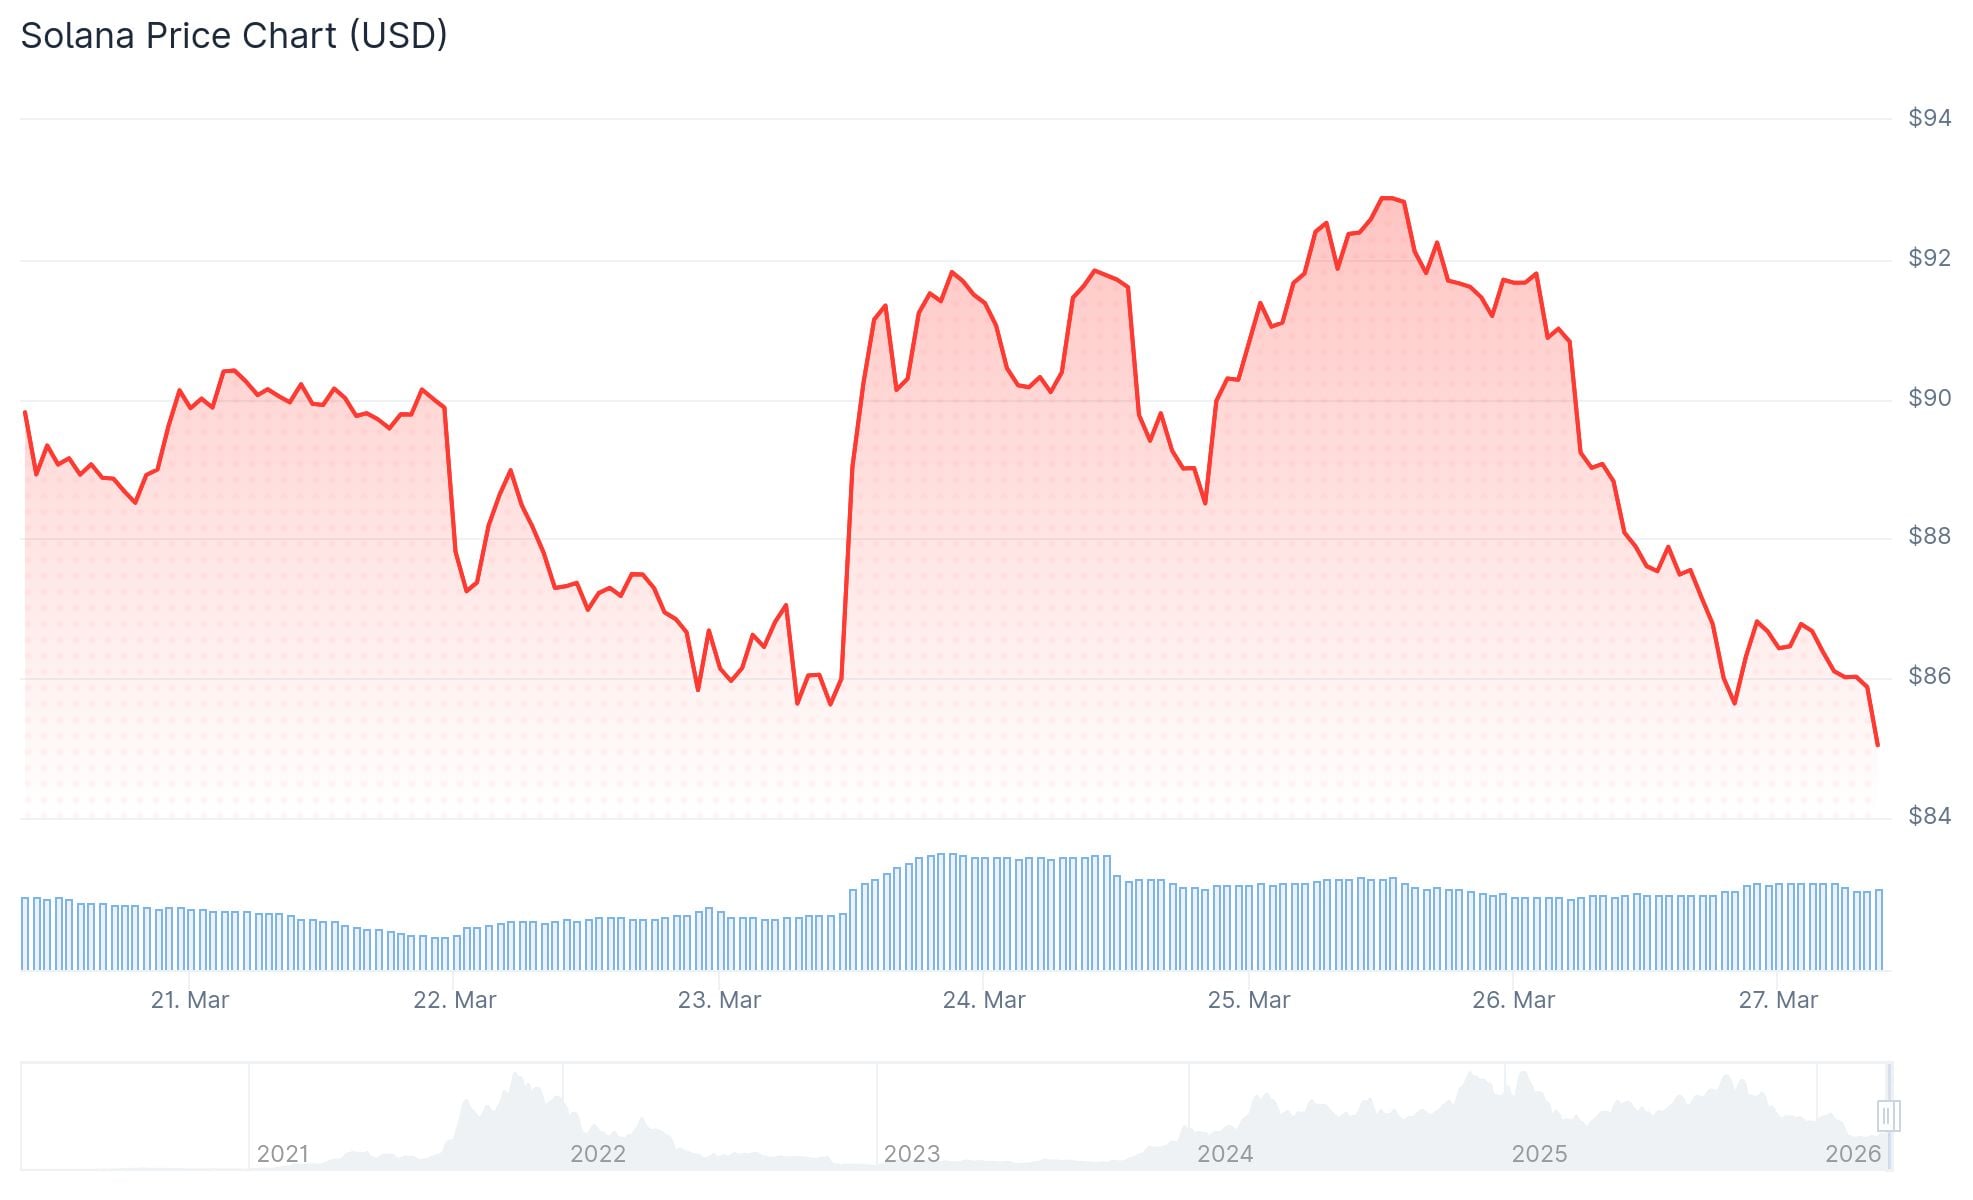
Currently, SOL is changing hands at $87.45. The 24-hour trading volume reached $5.62 billion, while the fully diluted market capitalization stands at $50.21 billion. The cryptocurrency has experienced a 5.70% decline during the previous 24-hour period.
The failure to break through $93 was highlighted by cryptocurrency analyst BitGuru in a March 26, 2026 post on X. The analyst noted that SOL has retreated to a significant historical support area following the unsuccessful resistance test. Price action at this critical juncture may determine the token’s near-term trajectory.
Should demand materialize at current levels, SOL might stage a recovery attempt targeting overhead resistance zones. Conversely, a breakdown below this support could trigger additional selling pressure.
Technical Indicators Reflect Bearish Sentiment
Solana is presently positioned underneath all primary moving averages. The 20-day moving average registers at $88.63, while the 50-day stands at $86.09. The 100-day moving average is located at $106.54, and the 200-day rests at $143.24.

Trading beneath both the 100- and 200-day moving averages indicates the asset remains distant from establishing sustainable upward momentum.
The Relative Strength Index reads 47.66, positioned below its signal threshold of 52.54. The MACD indicator shows a reading of 0.127, trailing its signal line at 0.232. The neutral MACD histogram configuration suggests minimal directional strength in the market.
Technical Pattern Points to Potential Downside
Chart analysis has revealed a bearish flag configuration developing on the daily timeframe — a pattern resembling a similar formation observed earlier in the current year. During that previous occurrence, Solana experienced a significant downward move following pattern completion.
The present structure displays price action consolidating within an ascending channel following a substantial decline. Should a breakdown occur from present price levels, technical projections indicate a potential move toward the $40 to $45 area within the next one to two weeks.
Notwithstanding the price deterioration, Solana’s blockchain infrastructure continues demonstrating robust performance. The network processed 825,729,338 transactions from a total of 1,867,616,231 blockchain transactions recorded during the measurement interval — representing 44% of worldwide cryptocurrency transaction volume.
Analyst Ali Charts pointed out on X that more than 100 million SOL tokens changed hands within the $91.45 to $82.60 price range, identifying this as the most critical demand area. Should this zone fail to hold, subsequent support levels worth monitoring include $53.10, $35.40, and $23.60.
Get 3 Free Stock Ebooks
Discover top-performing stocks in AI, Crypto, and Technology with expert analysis.
- Top 10 AI Stocks - Leading AI companies
- Top 10 Crypto Stocks - Blockchain leaders
- Top 10 Tech Stocks - Tech giants

