
 Faces Pressure as ETF Withdrawals Surge and Analyst Eyes $45–$75 Entry Zone")
TLDR
- Solana gained more than 2% on Monday following a week of consecutive declines that wiped out 5% of its value.
- Friday saw US-based Solana spot ETFs experience $7.84 million in net withdrawals, marking the fourth-largest daily exodus since launch.
- Derivative markets witnessed $22.98 million in SOL liquidations within 24 hours, predominantly from long positions totaling $19.18 million.
- Negative funding rates hit -0.0141%, indicating traders are compensating others to maintain bearish positions.
- Critical support zone identified between $70 and $75, with potential decline toward $50 if this level fails to hold.
Solana is attempting a rebound following a challenging week, though underlying market dynamics paint a more cautious picture. ETF capital flight, substantial liquidation events, and negative derivatives sentiment indicate this recovery could face headwinds.
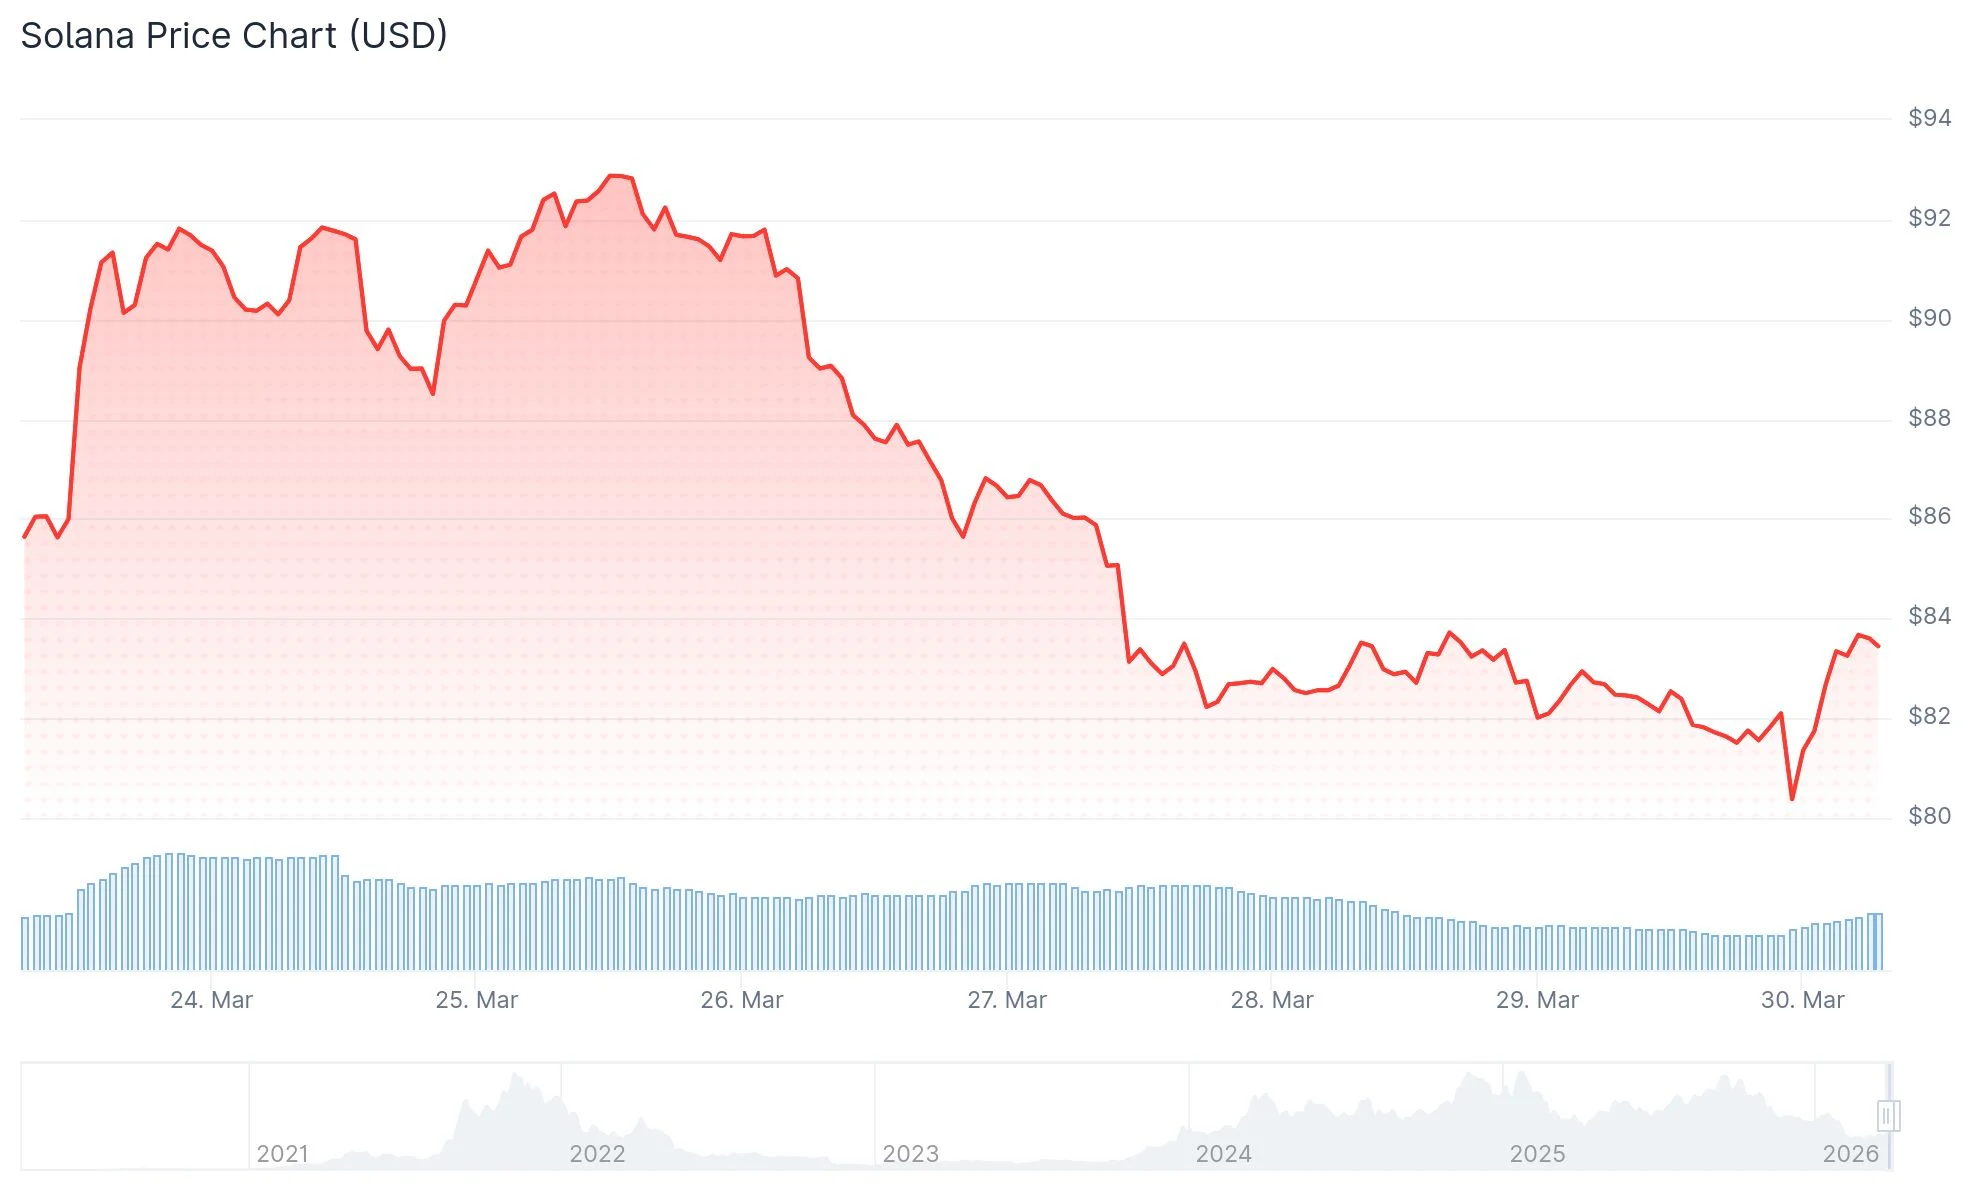
The previous week closed with Solana down approximately 5%, briefly dipping to lows around $81 before posting a modest 2% gain on Monday. The cryptocurrency breached a rising trendline support near $88, a development that technical analysts flagged as potentially significant.
All three major Exponential Moving Averages—the 50-day, 100-day, and 200-day—currently trade above the spot price, reinforcing a bearish technical configuration. For sentiment to shift, SOL would need to establish daily closes above the $91 threshold.
The MACD histogram has dipped beneath its signal line and entered negative territory. Meanwhile, the Relative Strength Index registers 42, below the midpoint of 50, confirming that selling pressure continues to dominate.
Friday’s data revealed $7.84 million in net capital withdrawal from US-based Solana spot ETFs. This represents the fourth-largest single-session outflow since these investment vehicles became available, extending a three-week streak of negative net flows.


Continued institutional capital withdrawal through the current week could amplify downward pressure on an already vulnerable price structure.
Within derivatives markets, the past 24 hours saw $22.98 million in SOL contract liquidations. Long positions absorbed the majority of this damage, accounting for $19.18 million in forced closures.
The negative funding rate at -0.0141% reveals that market participants are compensating counterparties to hold short positions—a clear indicator of prevailing bearish conviction.
Analysts Eye $70–$75 as the Key Zone
Crypto analyst Patel shared a two-week chart illustrating Solana’s approximate 77% decline from its peak near $250. His technical framework identifies a critical support and potential accumulation range spanning $45 to $75, with a Fibonacci retracement level positioned at $52.11 representing a deeper downside target.
Patel observed that optimistic commentary filled social channels when Solana traded above $250, yet has gone silent with prices below $80. He interprets the current weakness as a possible accumulation opportunity for patient investors, projecting long-term price objectives of $500 and $1,000.
A complementary technical assessment from More Crypto Online examined an hourly chart showing Solana breaking down from a short-duration ascending trendline. This analyst characterized the movement as a potential “wave 3” decline, targeting a support corridor between $71.91 and $77.91.
What the Charts Say Now
Near-term support rests at the recent $81.44 low. A breakdown through this floor would expose $75.63, the February 24 low that initiated the previous upward trajectory.
Overhead resistance clusters between $84.85 and $87.71, while the 50-day EMA at $91.24 represents a more substantial barrier to upside movement.
Market participants are monitoring SOL ETF activity closely, with Friday’s $7.84 million withdrawal serving as the most tangible evidence of institutional wariness.
Get 3 Free Stock Ebooks
Discover top-performing stocks in AI, Crypto, and Technology with expert analysis.
- Top 10 AI Stocks - Leading AI companies
- Top 10 Crypto Stocks - Blockchain leaders
- Top 10 Tech Stocks - Tech giants

