
 Price Analysis: 800% Spike in Exchange Inflows Signals More Pain Ahead")
TLDR
- Year-to-date losses for SOL exceed 30%, with consecutive rallies establishing progressively lower peaks
- Negative funding rates persist for 21 consecutive weeks, echoing a 2022 pattern that preceded a significant price surge
- Open interest plummeted from $7.58 billion down to $1.9 billion, eliminating much of the short squeeze potential
- Daily exchange deposits exploded 800% from February onward, climbing from 245,691 SOL to more than 2.2 million SOL
- Critical price floors identified at $82 and $75, with analysts eyeing $65 as a potential downside target upon breakdown
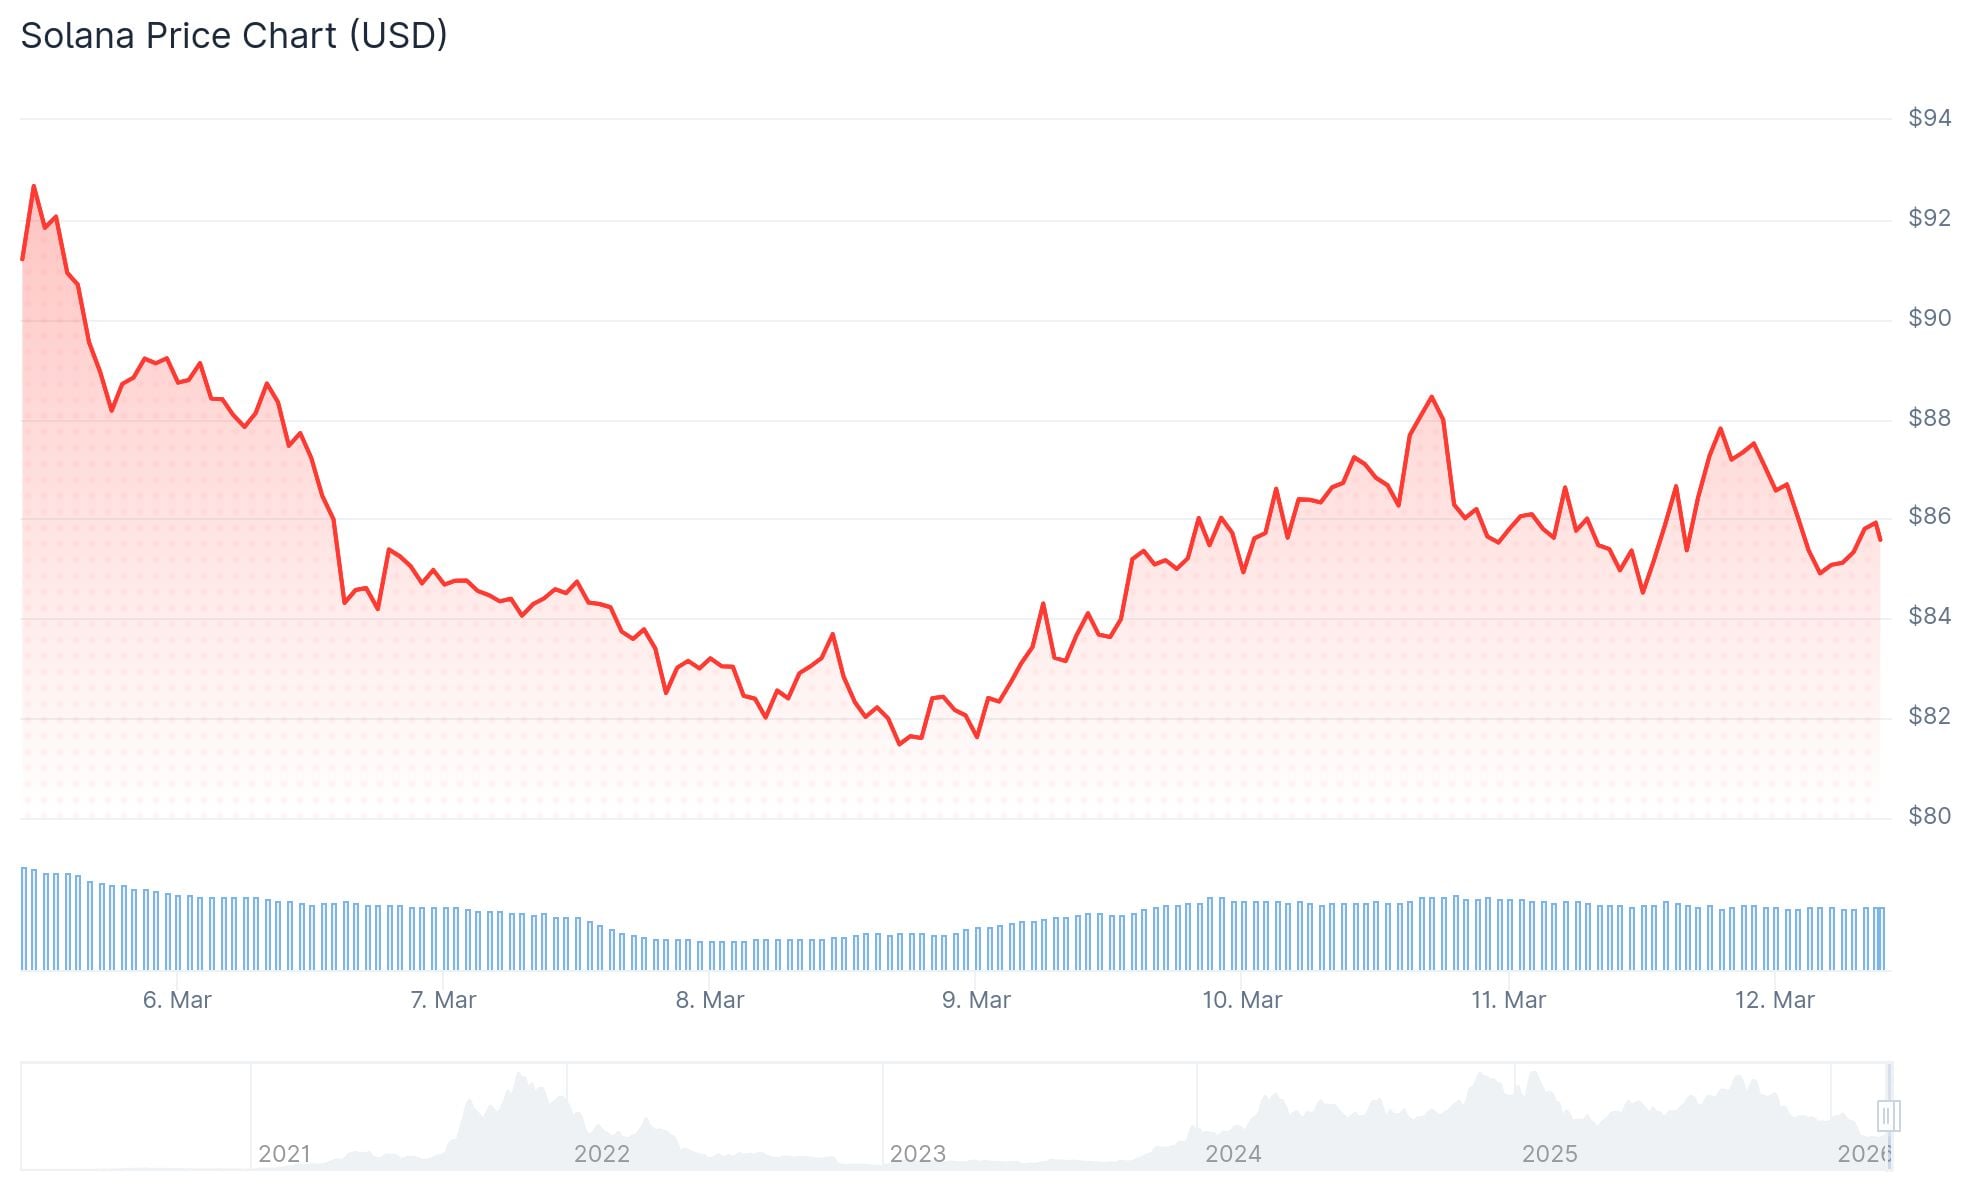
Over the last month, Solana has remained relatively stable, posting only a 1.4% decline. However, zooming out reveals a more troubling trend. Since the start of 2026, SOL has shed over 30% of its value, with every upward move consistently failing at lower resistance levels.
Beneath this surface-level stability, significant bearish pressure continues to accumulate.
A critical indicator from the derivatives market — the funding rate — has remained in negative territory for 21 consecutive weeks. When funding rates turn negative, short position holders compensate long traders, indicating a market dominated by bearish sentiment.
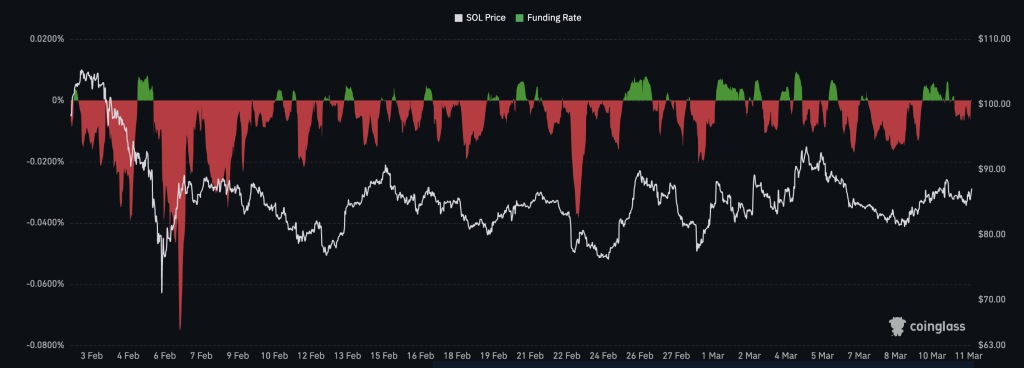
Historically, this pattern emerged between February 2022 and February 2023, lasting 53 weeks. Throughout that prolonged period, SOL eventually bottomed at $7 during the cycle low. However, following that streak’s conclusion, price action gradually improved — ultimately surging to $209 by March 2024.
While the current 21-week negative funding streak mirrors that historical setup, there’s a crucial distinction this time around.

Open Interest Has Dried Up
Derivatives open interest for SOL reached its zenith at $7.58 billion in September 2025. Currently, it hovers around $1.9 billion — marking the lowest level since early March 2025. This represents an approximate 75% contraction.
Reduced open interest indicates insufficient leveraged short positions exist to catalyze a substantial short squeeze. Without this catalyst, price recoveries typically lack momentum and fade quickly.
Technically, SOL has remained confined within an ascending channel structure since early February. While this formation might appear constructive, it emerged immediately following a precipitous decline from $148 to $68. Market analysts interpret this as a bearish continuation pattern rather than a bullish reversal signal.

Exchange Inflows Are Climbing Fast
Blockchain data reinforces the bearish narrative. Solana exchange net inflows have remained positive continuously since February 10. On that initial date, approximately 245,691 SOL flowed onto exchanges daily. By March 10, this figure had skyrocketed to 2,204,783 SOL — representing an approximately 800% surge within a single month.
When tokens migrate onto exchanges in large volumes, it typically signals holders preparing to liquidate positions.
For a genuine price floor to establish itself, analysts emphasize these inflows must reverse into consistent outflows. That transition hasn’t materialized yet.
Immediate chart support rests at $82, followed by $79. Should these levels fail, the measured projection from the channel pattern targets $65.
Conversely, a daily close surpassing $94 would disrupt the pattern of declining highs. A breakout above $118 would be required to validate a complete bullish trend reversal.
As of March 11, 2026, SOL exchanges hands near $85, with exchange inflows continuing their ascent and open interest languishing at multi-month lows.
Get 3 Free Stock Ebooks
Discover top-performing stocks in AI, Crypto, and Technology with expert analysis.
- Top 10 AI Stocks - Leading AI companies
- Top 10 Crypto Stocks - Blockchain leaders
- Top 10 Tech Stocks - Tech giants

