
 Price Analysis: Critical $80 Support Zone Under Scrutiny")
TLDR
- SOL reached a bottom at $80.29 following breach of critical $88 and $85 support zones
- Immediate resistance sits at $85.50 based on a bearish trend line visible on the hourly timeframe
- Last week brought $24 million in net ETF inflows, though the period concluded with consecutive outflow days
- Derivatives Open Interest climbed 1% to reach $5.01 billion, while $15.52 million worth of long contracts faced liquidation over 24 hours
- RWA wallet count on Solana now exceeds Ethereum’s numbers, though Ethereum maintains dominance with $15.5 billion versus Solana’s $1.8 billion in tokenized value
Solana experienced significant downward pressure throughout the previous week, plummeting to $80.29 before managing a modest recovery. Currently, the price continues trading beneath the $85 threshold and below the 100-hour simple moving average.
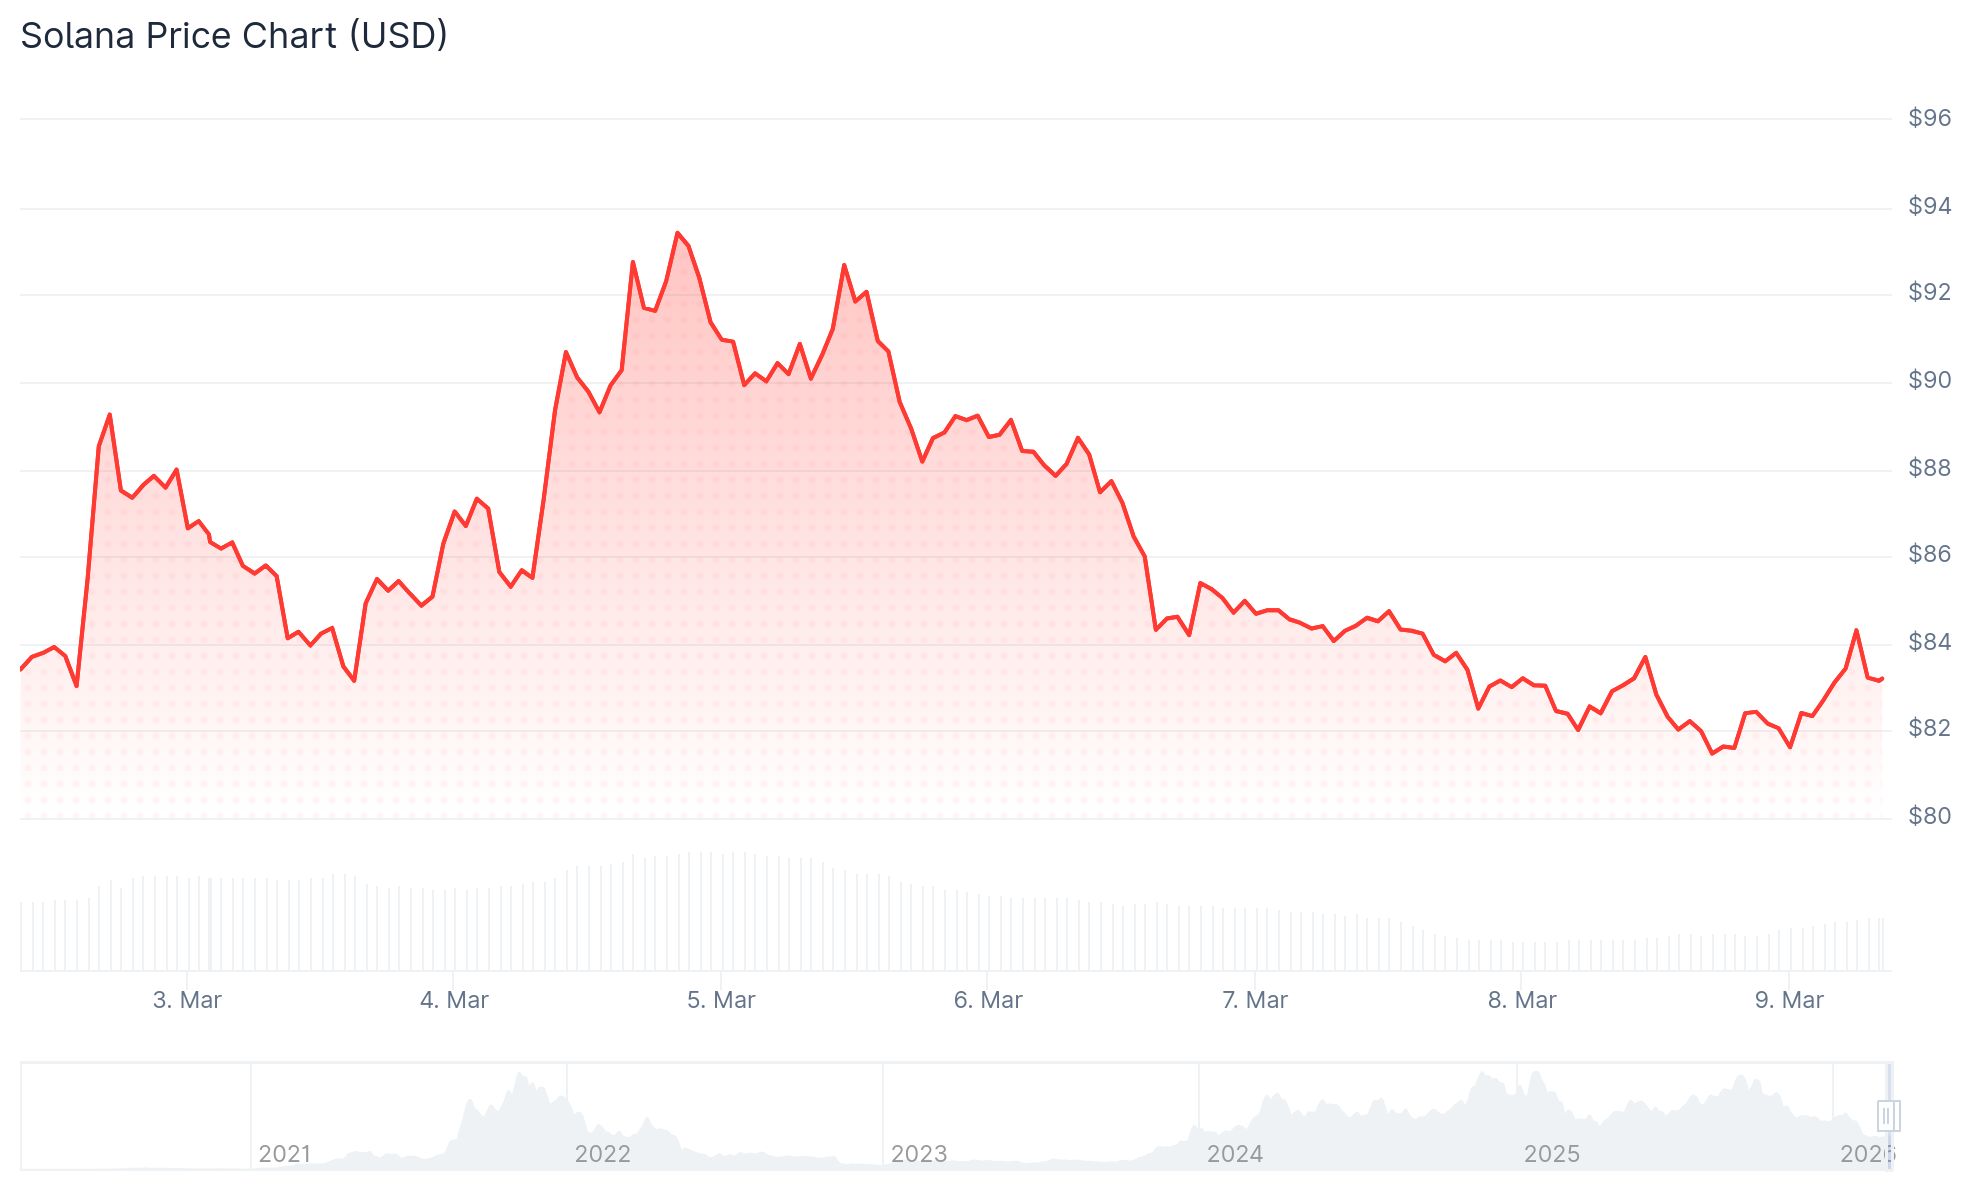
The decline came after bulls failed to maintain momentum above the $90 level. SOL subsequently pierced through both the $88 and $85 support barriers before finding temporary footing around $80.
On the hourly chart, a bearish trend line currently positioned at $85.50 represents the primary near-term obstacle. Additional resistance emerges at $87.20, corresponding to the 50% Fibonacci retracement level from the latest downturn, with more substantial resistance appearing at $88.80.
Should SOL successfully breach the $88.80 barrier, traders would eye $95 and possibly $102 as subsequent targets. Conversely, a breakdown below $80 would expose support zones at $72 followed by $65.
Monday’s session brought approximately 2% gains for SOL after enduring four consecutive days of decline. Nevertheless, the overall trend structure remains tilted toward the bears. The token currently trades beneath its 50-day, 100-day, and 200-day exponential moving averages.

The Relative Strength Index registers at 43, positioned below the neutral 50 threshold. Meanwhile, the MACD histogram shows contraction, indicating diminishing bullish momentum.
Solana ETF Flows Show Mixed Signals
Current holdings in US spot Solana ETFs total approximately $800 million in SOL. Cumulative net inflows reached $957 million through Friday, demonstrating that institutional participants largely maintained their positions throughout the recent price decline.

The previous week concluded with $24 million in net inflows. However, the closing two trading sessions registered outflows totaling $5.23 million and $8.23 million respectively.
Market observers attribute these late-week redemptions to broader market stress stemming from escalating oil prices and heightened geopolitical uncertainty.
Open Interest across SOL derivatives markets expanded 1% during a 24-hour window, reaching $5.01 billion. The funding rate demonstrated improvement, shifting from -0.0161% to -0.0006%, suggesting diminished bearish sentiment among derivatives traders.
Despite this improvement, total liquidations reached $19.79 million during the same timeframe. Long position liquidations accounted for $15.52 million of this total.
Solana Passes Ethereum in RWA Wallet Count
Solana now boasts 154,942 wallets containing tokenized real-world assets, eclipsing Ethereum’s count of 153,592. This marks the inaugural instance of Solana surpassing Ethereum in this particular metric.
This expansion stems primarily from retail participants acquiring tokenized equity shares of corporations like Tesla and Nvidia via Solana’s cost-efficient infrastructure.
Nevertheless, Ethereum maintains substantial dominance with $15.5 billion in tokenized RWA value compared to Solana’s $1.8 billion. Additionally, Ethereum supports 663 tokenization initiatives versus Solana’s 345 projects.
Major asset managers including BlackRock and Fidelity utilize Ethereum for offerings such as tokenized Treasury securities and money market instruments. While Solana has attracted select institutional deployments from BlackRock, its RWA ecosystem remains predominantly retail-focused.
The initial support level for SOL appears at $78.35, representing the final significant floor before reaching $67.50, established during the February 6 low.
Get 3 Free Stock Ebooks
Discover top-performing stocks in AI, Crypto, and Technology with expert analysis.
- Top 10 AI Stocks - Leading AI companies
- Top 10 Crypto Stocks - Blockchain leaders
- Top 10 Tech Stocks - Tech giants

