
 Price Analysis: Critical Zones Investors Must Monitor This April")
Quick Overview
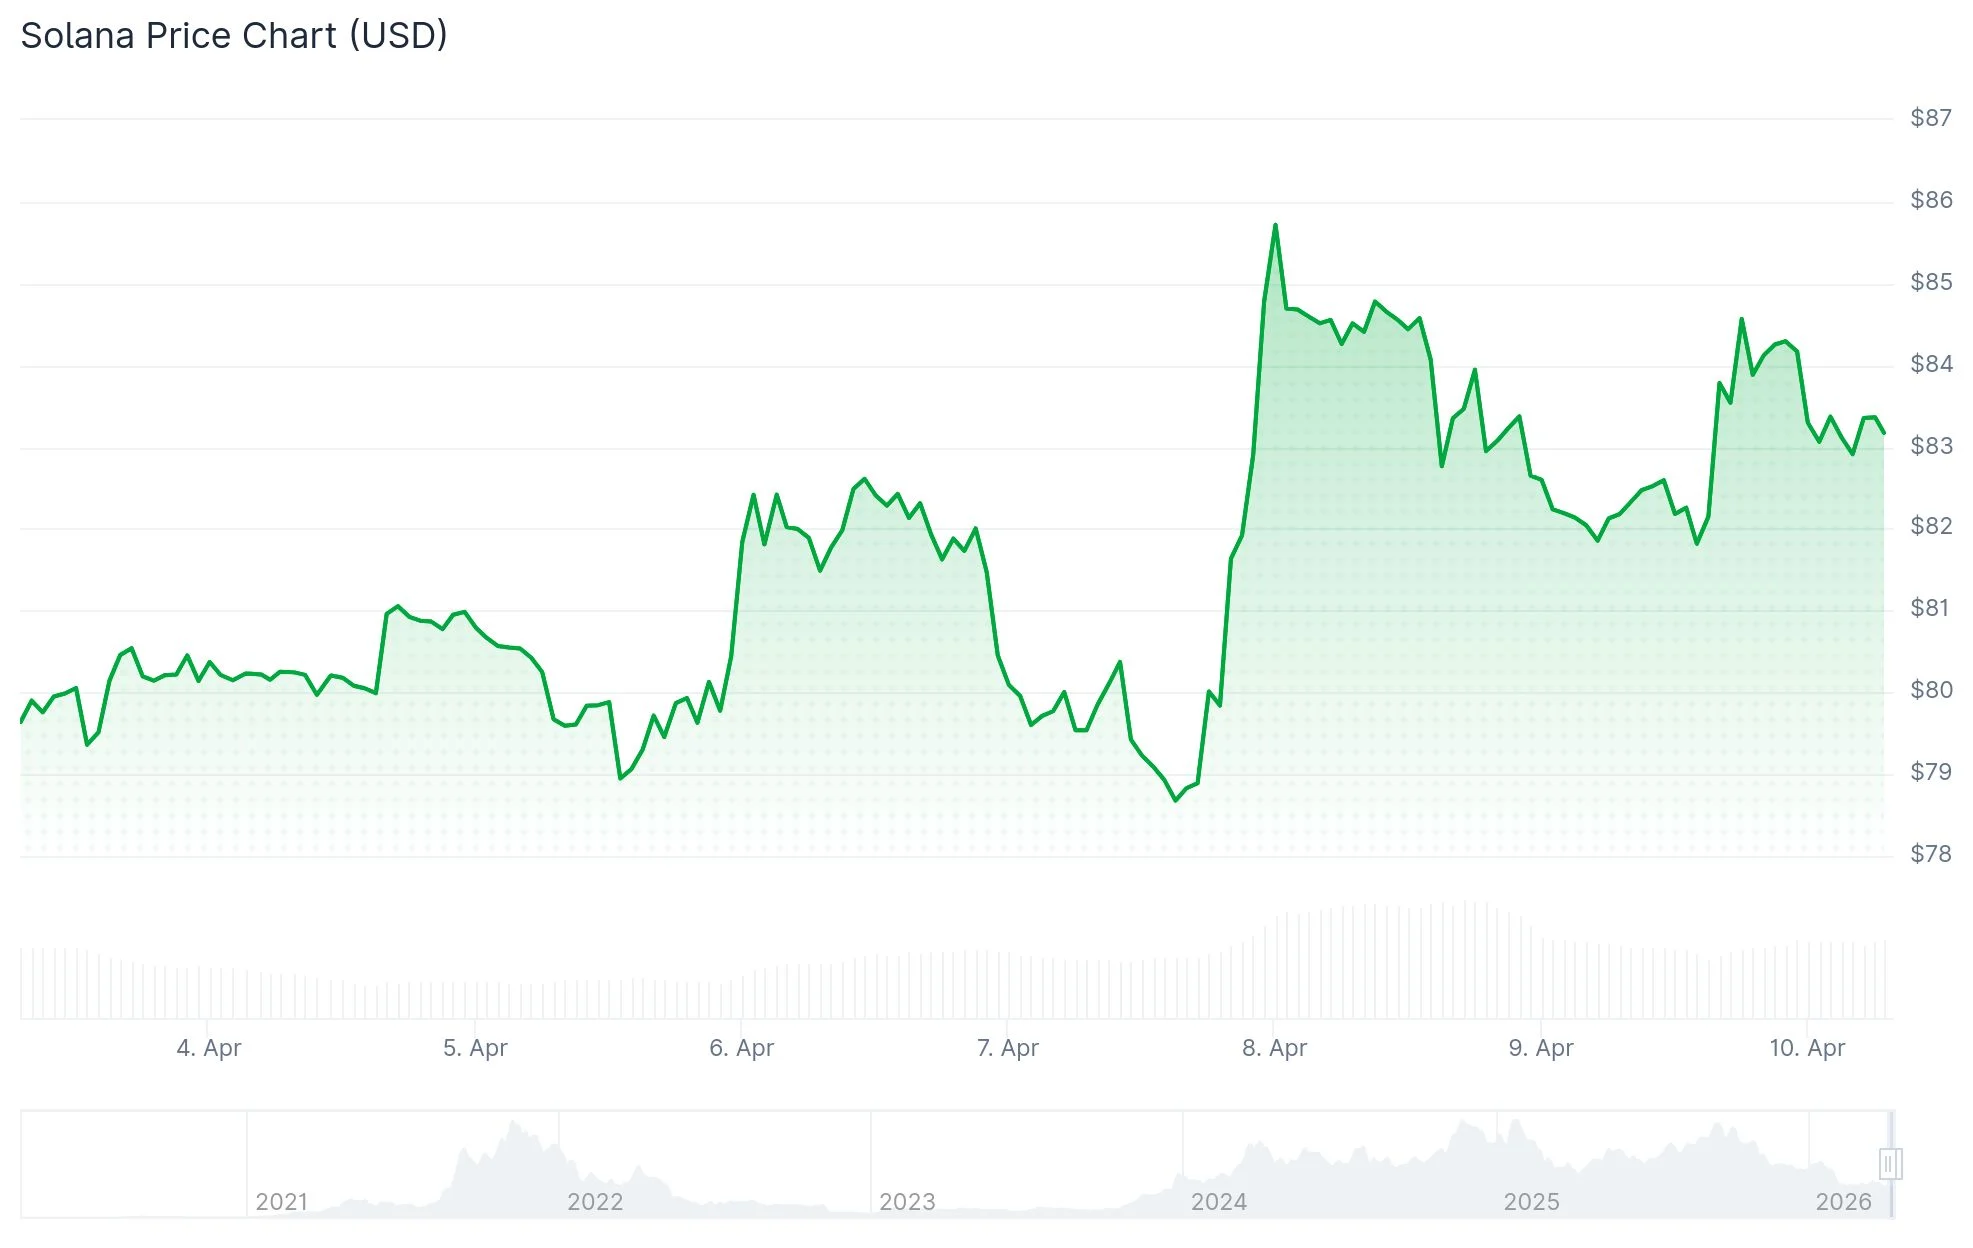
- SOL maintains position near $83, remaining confined below a falling trendline and major moving average indicators
- Institutional Solana ETF products experienced $17.08 million in net outflows this week, with Tuesday recording an unprecedented $15.40 million single-day exit
- Derivatives markets witnessed $7.99 million in liquidations across 24 hours, predominantly affecting short sellers
- Critical overhead resistance zone lies at the 50-day EMA between $87–$88
- Technical analyst Ali Martinez identified a recurring price pattern where SOL temporarily crosses above the 50-day MA before retreating sharply
Solana is currently hovering near $83 as of Friday, April 10, maintaining stability above the crucial $80 threshold while facing difficulty generating upward momentum. The cryptocurrency remains pressured beneath its 50-day, 100-day, and 200-day Exponential Moving Averages (EMAs), creating a neutral to bearish short-term technical picture.
A declining resistance line drawn from the January 14 peak through the April 7 high is creating downward pressure, intersecting with the 50-day EMA in the $87 to $88 region. SOL has repeatedly failed to establish a daily close above this critical confluence zone.
The Relative Strength Index (RSI) currently registers at 47, indicating neutral to slightly bearish momentum conditions. Meanwhile, the Moving Average Convergence Divergence (MACD) displays a marginally bullish signal, though insufficient to confirm a meaningful trend reversal at this stage.
Institutional ETF Products Experience Significant Capital Withdrawal
Institutional appetite for Solana exposure has diminished markedly during this trading week. United States-based spot SOL exchange-traded funds have witnessed cumulative net outflows totaling $17.08 million, highlighted by Tuesday’s historic single-session withdrawal of $15.40 million.

Persistent ETF capital flight generally signals institutional portfolio rebalancing and frequently exerts downward pressure on underlying asset valuations.

Within derivatives markets, CoinGlass tracking reveals $7.99 million in aggregate liquidations during the preceding 24-hour period. Notably, $5.97 million of these forced closures affected short positions, indicating bearish speculators absorbed the majority of losses. Open Interest contracted 1.48% to $4.78 billion, signaling diminished overall market participation.
The OI-weighted funding rate maintains a marginally positive reading of 0.0038%, while the long-to-short ratio stands at 1.0141, demonstrating a slight bias toward bullish positioning among active traders.
Technical Expert Identifies Recurring Breakdown Configuration
Cryptocurrency market analyst Ali Martinez shared observations via X platform, pointing to a formation that has materialized three separate times since November 2025. In each instance, SOL temporarily recovered above the 50-day Moving Average before losing momentum, entering consolidation, and subsequently experiencing pronounced downward movement.
Martinez emphasized that extended periods below the 50-day MA historically increase the probability of additional downside based on SOL’s recent behavioral patterns.
Solana has predominantly oscillated within a $78 to $92 corridor since a turbulent trading session on March 5, during which the asset plummeted from $92 to $78 within a single day.
Regarding upside scenarios, a confirmed daily close exceeding $88 would establish a pathway toward the 100-day EMA positioned near $99.86. Conversely, should SOL breach below $80, subsequent support zones appear at $76.50, with AMBCrypto identifying $47.90 as a potential extended downside objective based on weekly chart architecture from February analysis.
SOL’s primary resistance barriers remain positioned at $85, followed by $88. Critical support levels worth monitoring include $82.50, $81.40, and $80.
Get 3 Free Stock Ebooks
Discover top-performing stocks in AI, Crypto, and Technology with expert analysis.
- Top 10 AI Stocks - Leading AI companies
- Top 10 Crypto Stocks - Blockchain leaders
- Top 10 Tech Stocks - Tech giants

