
 Price Analysis: Key Technical Indicators Point to Possible Upside Momentum")
TLDR
- Solana price retreated below $90 but found solid footing near the $85 support zone
- Relative Strength Index reading of 47.68 indicates neutral conditions without clear directional bias
- Token broke back above Ichimoku cloud on 4H timeframe—first occurrence since late January
- Technical analysts highlight $88.60 as critical resistance; clearing it could trigger move toward $95–$100 zone
- Golden cross formation emerged as 50MA moved above 100MA, suggesting near-term momentum change
Solana (SOL) is currently changing hands in the $87–$88 range following a retreat from its recent peak at $90.29. The digital asset briefly slipped beneath both the $88 and $87 marks before stabilizing above the $85 support threshold.
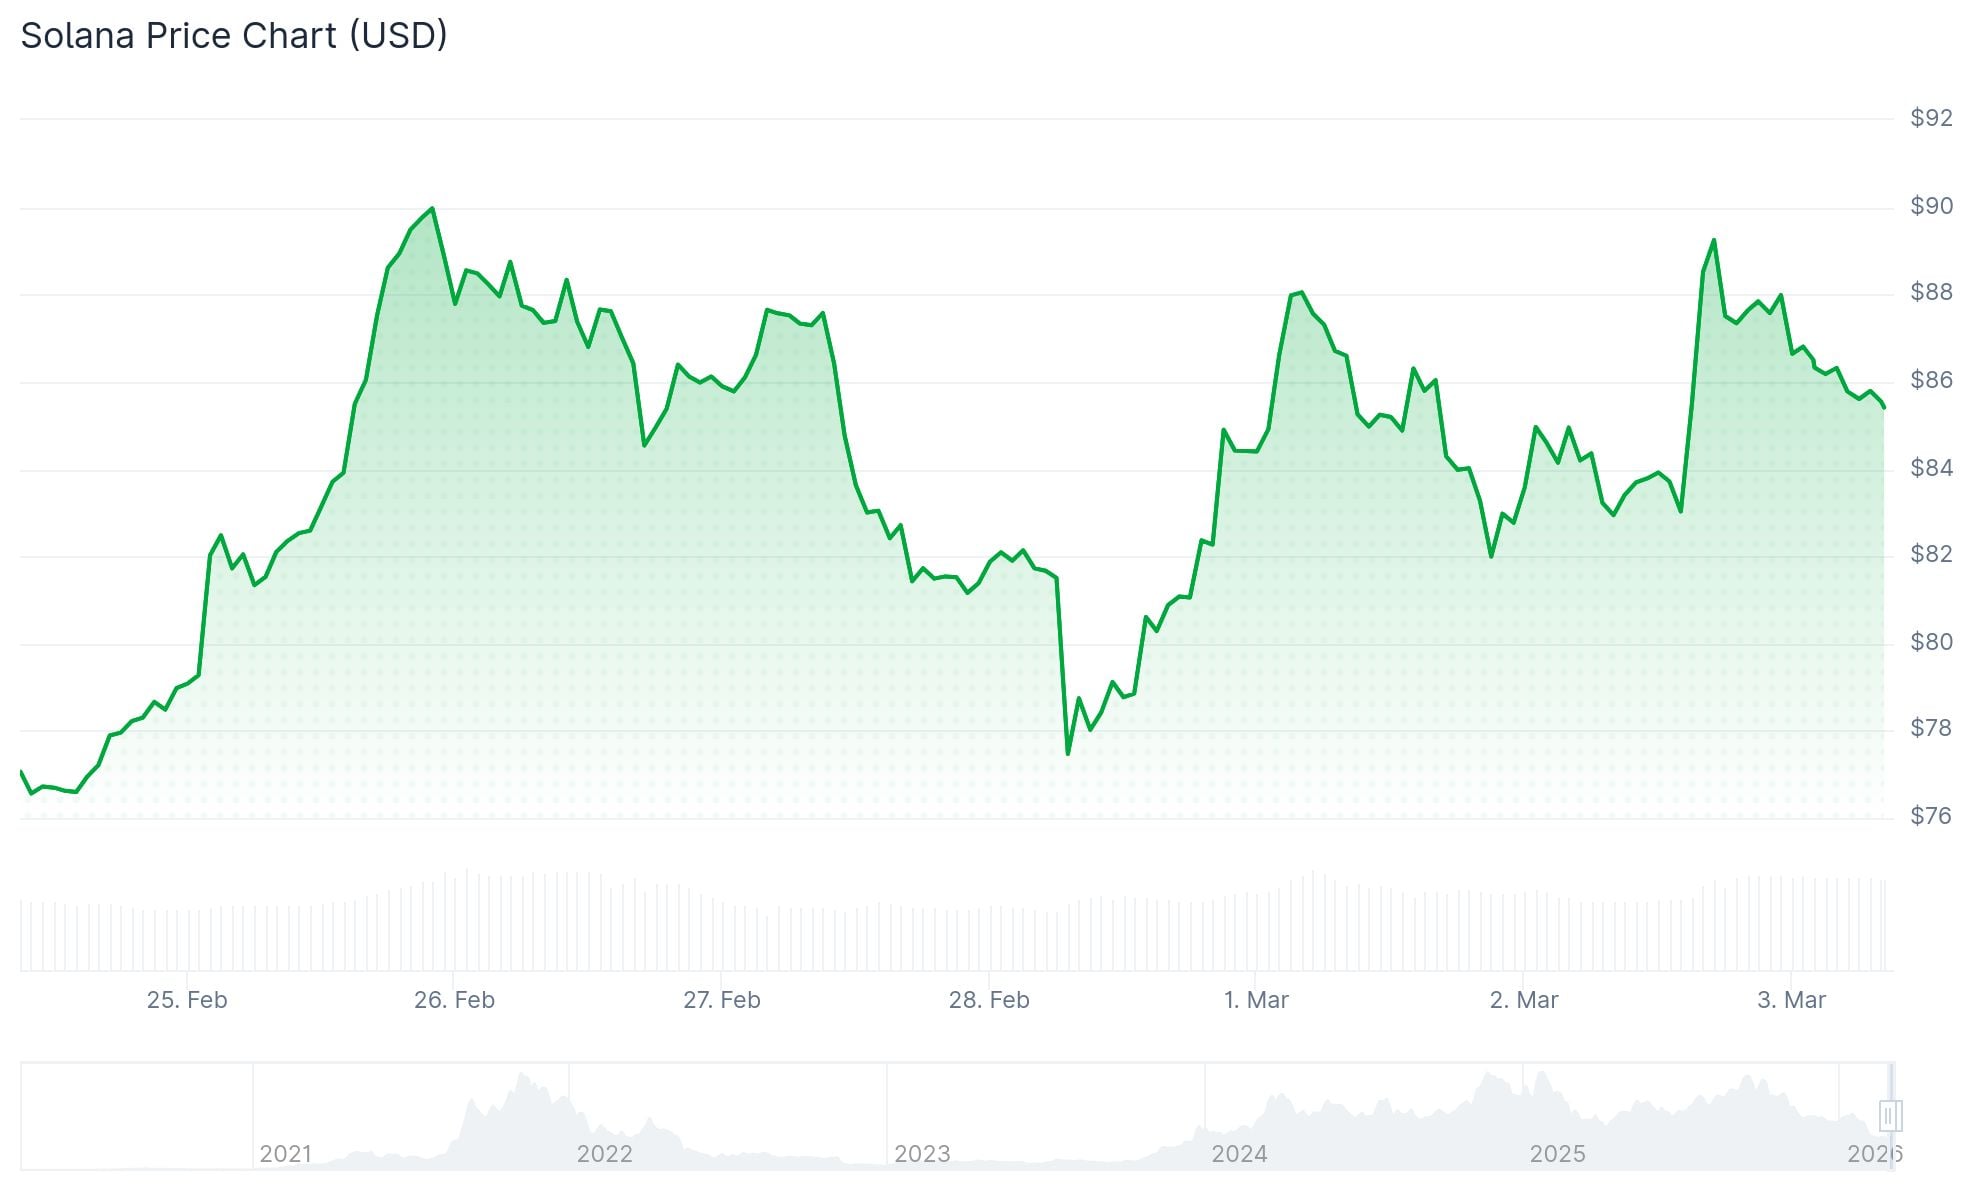
The token is maintaining its position above the 100-hour simple moving average. Current 24-hour volume stands at $9.99 billion, while market capitalization reaches $49.91 billion. The asset has gained 4.70% in the last day of trading.
During the recent correction, price action fell beneath the 50% Fibonacci retracement level measured from the $81.71 low to the $90.29 high. An ascending trend line has emerged on the hourly timeframe, providing support around $85, which coincides with the 61.8% Fibonacci retracement.
Crypto analyst BitGuru observed on March 2 that Solana appears to have completed its correction phase and moved into a consolidation pattern. He highlighted the formation of higher lows around a well-defined support area as indication that selling momentum is diminishing.
Technical observers are focused on $88.60 as the initial critical threshold to overcome. Analyst More Crypto Online indicated that surpassing Sunday’s high at $88.60 would demonstrate that buying pressure is returning to the market.

Key Resistance Levels to Watch
Immediate resistance barriers are positioned at $88, followed by $90, and then $92. Successfully closing above $92 could pave the way toward $96 and ultimately the psychological $100 level.
Should SOL encounter rejection at $90, downside targets include $84 initially, then $82. Breaking below $82 could result in a decline toward $76.50.
The Relative Strength Index currently registers 47.68—firmly in neutral territory. The MACD indicator shows 1.80, marginally positive, yet remains beneath its signal line at -4.29. Bearish pressure is subsiding, though bullish conviction hasn’t fully materialized.
Solana continues trading significantly beneath its longer-duration moving averages. The 50-day simple moving average sits at $103.66, the 100-day at $117.73, and the 200-day at $156.34.
Ichimoku Cloud Break Signals Shift
On the four-hour chart, Solana has reclaimed position above the Ichimoku cloud for the first time since January concluded. During February’s entirety, each upward attempt failed below this technical cloud formation.
Additionally, the 50-period moving average has completed a bullish crossover above the 100-period moving average on the 4-hour chart. Market analyst CryptoCurb characterized this development as a fundamental shift in underlying trend structure.
Both moving averages have started angling upward. A technical projection provided by CryptoCurb suggests potential advancement toward $100 and higher, provided price maintains position above the recently reclaimed technical levels.
Currently, SOL trades at $87.64 with preliminary recovery indicators emerging, though a definitive trend reversal remains unconfirmed at this stage.
Get 3 Free Stock Ebooks
Discover top-performing stocks in AI, Crypto, and Technology with expert analysis.
- Top 10 AI Stocks - Leading AI companies
- Top 10 Crypto Stocks - Blockchain leaders
- Top 10 Tech Stocks - Tech giants

