
 Price: Breaks $200 Resistance as Capital Inflows Top $1 Billion")
TLDR
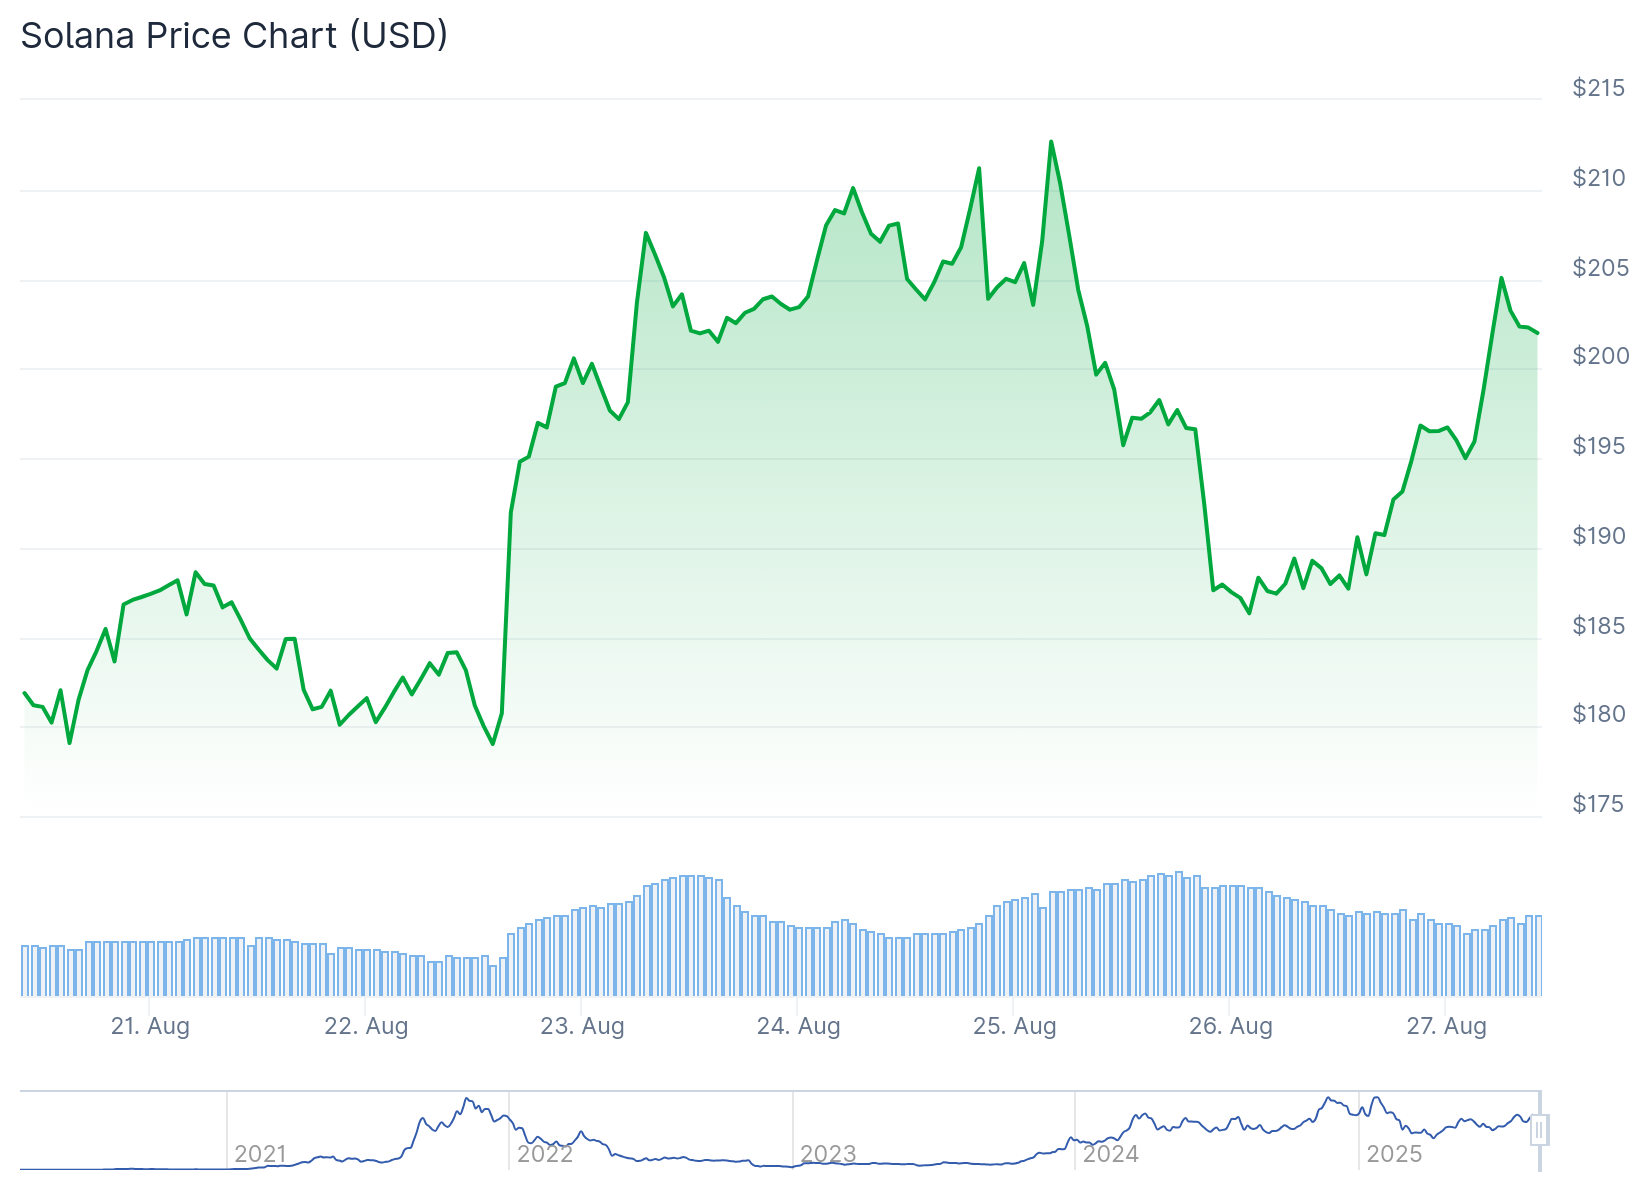
- SOL encounters stubborn resistance around $200 mark with multiple rejection attempts in past six weeks
- Network transaction volume declined 10% while processing fees dropped 17% week-over-week
- Triangle formation on weekly charts suggests potential breakout toward $320-$350 if $260 resistance breaks
- Billion-dollar capital inflows into Solana network demonstrate continued institutional interest
- Pending SEC ETF decisions carry 90%+ approval probability according to market analysts
SOL encounters persistent headwinds at the $200 price threshold. The token trades near $184 following recent consolidation phases.
Weekly performance shows mixed results for SOL holders. Daily gains of 3.55% contrast with weekly losses of 6.7%.
Monthly charts reveal deeper declines of 6.27%. The cryptocurrency peaked near $294 during previous bull market cycles.
Market participants question factors preventing sustained moves higher. Competitor tokens like ETH and BNB recently achieved new record highs.
Network data reveals concerning trends for SOL fundamentals. Transaction processing declined 10% during the past seven days.
Network Metrics Paint Mixed Picture
Revenue generation through fees dropped 17% compared to prior week. These metrics contrast sharply with competing blockchain networks.


BNB Chain maintained flat transaction levels while fees increased 6%. Ethereum’s layer-2 solutions showed stronger momentum.
Base network transactions jumped 14% during the same period. Arbitrum recorded even stronger gains of 20% week-over-week.
Chain revenue fell 91% from January peaks this year. The decline coincided with memecoin speculation around political tokens.
Total value locked remains substantial at $12.5 billion. This figure represents strong user commitment despite recent challenges.
Capital movement data provides more encouraging signals. Cross-chain bridging activity shows $1 billion flowing into Solana over 30 days.
These inflows exceeded combined totals for Ethereum, Arbitrum, and Base. Solana captured 42% of all bridging volume recently.
Institutional interest appears to maintain momentum despite price weakness. Galaxy Digital partners are raising $1 billion for Solana-focused treasury operations.
The Solana Foundation endorsed this institutional initiative. Bloomberg reported details of the fundraising efforts.
Solana Price Prediction
Chart patterns suggest potential for upward movement. Weekly timeframes display ascending triangle formations.
Resistance levels cluster between $250 and $260. Price action maintains higher lows throughout consolidation periods.
Technical strategists view this pattern as bullish continuation setup. Confirmed breaks above $260 could target $320-$350 levels.
Shorter timeframes show falling wedge patterns developing. Four-hour charts indicate narrowing price ranges near $176 support.
Breakout signals emerge if price clears $188-$190 resistance zone. Volume increases during support tests indicate buyer interest.
Whale activity introduces near-term uncertainty to price outlook. Large holders unstaked 100,000 SOL tokens worth $18 million recently.
These tokens moved to Binance exchange for potential distribution. Such transfers often precede selling or hedging activities.
Support levels between $169 and $176 become critical if selling pressure emerges. This range has provided defense during recent weeks.
Futures market sentiment remains balanced according to derivatives data. Perpetual contracts show 10% annualized premiums.
This level indicates neutral positioning among professional traders. Binance top-trader ratios shifted toward bearish sentiment recently.
SEC decisions on spot ETF applications remain pending catalyst. Bloomberg analysts estimate approval odds exceeding 90%.
Final deadlines approach in mid-October for regulatory determinations. Positive outcomes could drive institutional adoption.
Current price action suggests SOL stands at inflection point between continued consolidation and potential rally phases.
Get 3 Free Stock Ebooks
Discover top-performing stocks in AI, Crypto, and Technology with expert analysis.
- Top 10 AI Stocks - Leading AI companies
- Top 10 Crypto Stocks - Blockchain leaders
- Top 10 Tech Stocks - Tech giants

