
 Price: Bulls Eye $200 Target as Network Sees Record $1 Billion Inflows")
TLDR
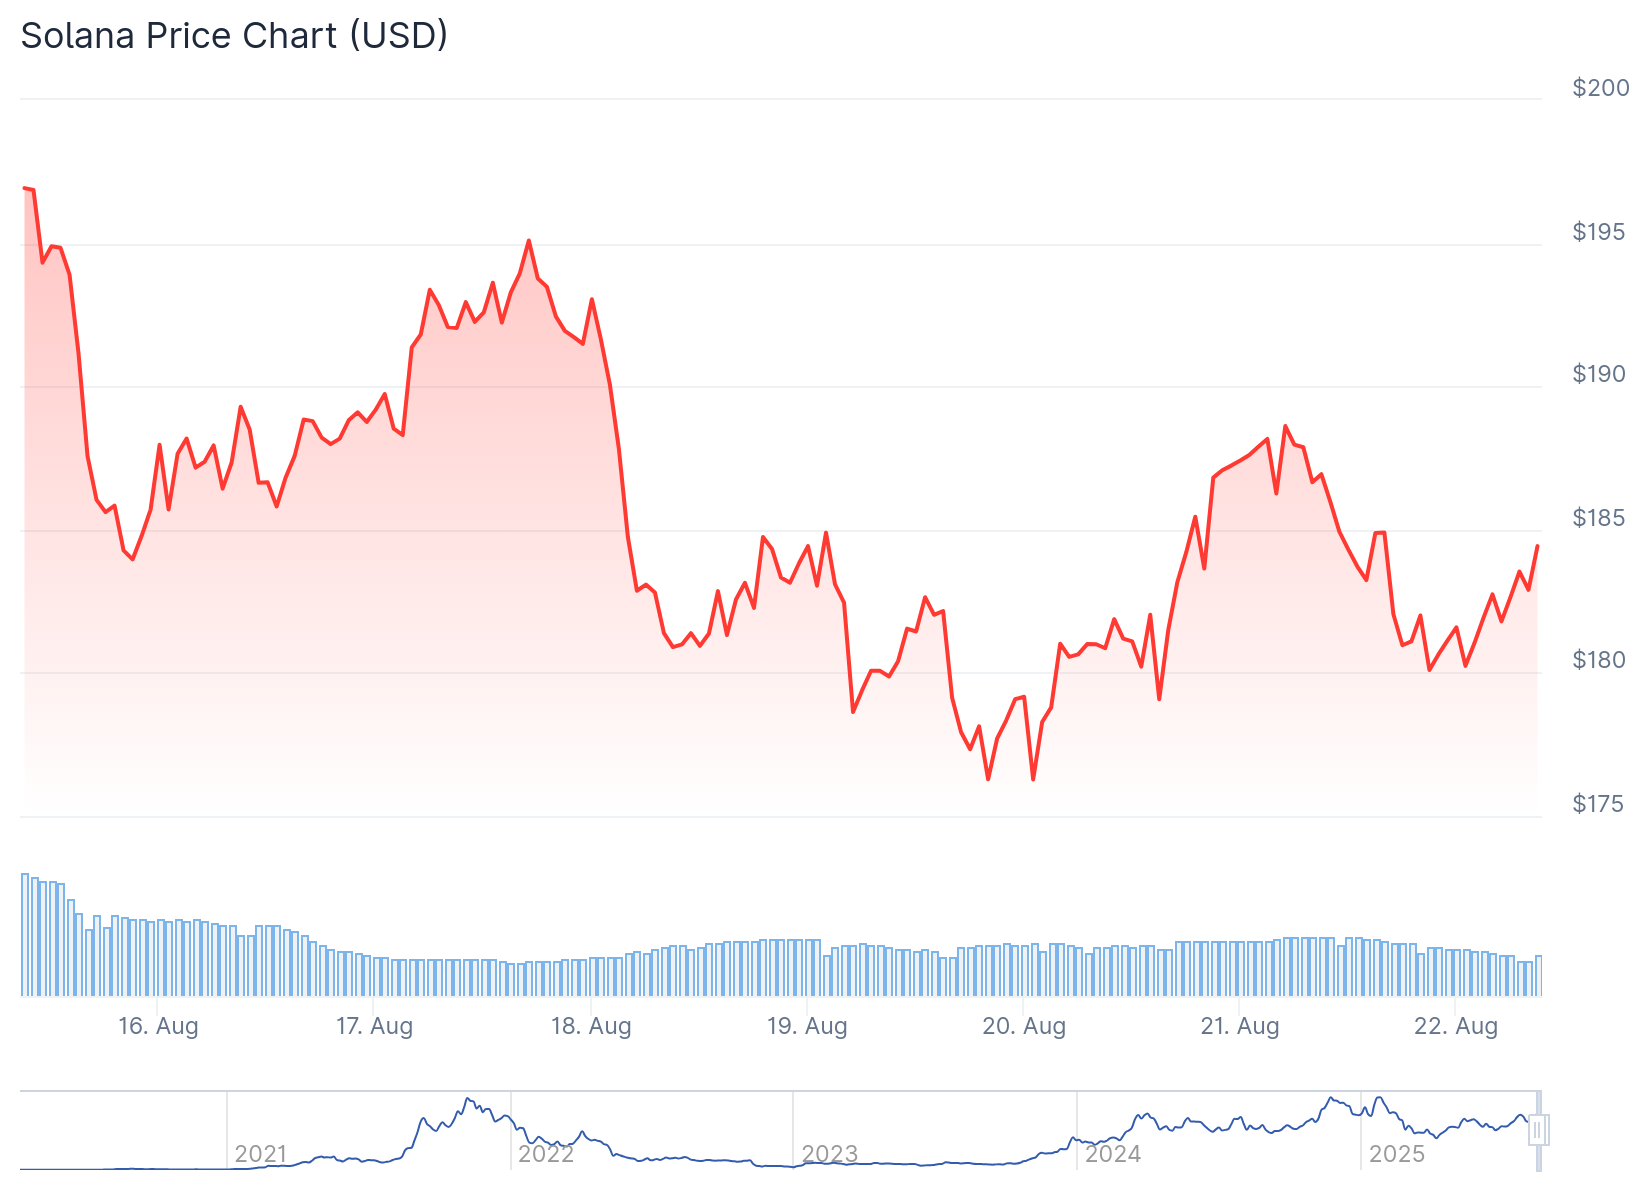
- SOL trades at $184, up 3.55% daily but down 6.7% weekly with $200 resistance in focus
- Record $1 billion flowed into Solana network over 30 days, capturing 42% of cross-chain activity
- Network achieved new 2,300 transactions per second milestone, setting performance record
- Technical charts show ascending triangle and falling wedge patterns favoring upward movement
- Whale moved $18 million worth of SOL to Binance, creating potential selling pressure
Solana price action has traders watching closely as the cryptocurrency approaches critical resistance levels. SOL currently trades around $184, marking a 3.55% gain over 24 hours while posting weekly and monthly declines of 6.7% and 6.27% respectively.
The token remains below its all-time high near $294. However, multiple factors suggest potential for upward movement toward the $200 resistance zone.
On-chain metrics paint a bullish picture for Solana’s fundamental strength. Data shows over $1 billion in capital entered the network during the past month through cross-chain bridging. This inflow volume exceeded competing networks including Ethereum, Arbitrum, and Base.
Solana captured 42% of total bridging activity across major blockchain networks. Ethereum trailed during the same measurement period. These inflows indicate growing demand beyond typical memecoin speculation.
Network performance reached new heights with transaction speeds surpassing 2,300 transactions per second. This figure represents an all-time high for Solana and demonstrates continued infrastructure improvements.
Solana Price Prediction
Chart analysis reveals several positive formations across different timeframes. Weekly charts display an ascending triangle where SOL repeatedly tested resistance between $250-$260 while maintaining upward trending support.

Technical strategists view this pattern as typically preceding upward breakouts. A sustained close above $260 could validate the triangle formation and open pathways toward $320-$350 price targets.
Four-hour charts show a falling wedge pattern developing near the $176 support level. Falling wedges often signal reversals when price breaks above the upper boundary.
Analysts identify $188-$190 as the initial breakout zone that would confirm momentum shifting toward buyers. Volume has increased during each support test, suggesting diminishing selling pressure.
The $175-$180 range has provided consistent support during recent consolidation. Higher low formations indicate buyers remain active at these levels.
Whale Activity Creates Near-Term Uncertainty
Large holder movements have introduced some caution into the outlook. On-chain tracking revealed a whale unstaked nearly 100,000 SOL tokens worth approximately $18 million and transferred them to Binance.
Exchange transfers often indicate potential selling or hedging activity. While this movement doesn’t invalidate existing technical patterns, it could introduce selling pressure if the whale liquidates holdings.
Support between $176-$169 becomes critical for maintaining bullish structure. This range has served as a defensive zone during recent price declines.
Market participants emphasize that a breakout above $200 would validate multiple technical patterns. The combination of strong inflows, record network performance, and constructive chart patterns supports the case for continued upward movement.
Solana’s ability to maintain stability while other altcoins face pressure positions it as a potential outperformer if broader market conditions improve.
Get 3 Free Stock Ebooks
Discover top-performing stocks in AI, Crypto, and Technology with expert analysis.
- Top 10 AI Stocks - Leading AI companies
- Top 10 Crypto Stocks - Blockchain leaders
- Top 10 Tech Stocks - Tech giants

