
 Price: Could October ETF Approval Trigger Massive Institutional Buying Wave")
TLDR
- Solana price fell to $192 on Thursday, breaking below the crucial $200 support level after reaching $253 highs
- Grayscale’s spot SOL ETF faces key approval deadline on October 10, with five additional applications pending through 2025
- Network activity declined 25% this month as daily active addresses dropped to 3.04 million users
- Institutions currently hold less than 1% of SOL supply compared to 16% of Bitcoin and 7% of Ethereum
- Technical indicators show RSI at 40.54 confirming bearish momentum, though historical patterns suggest potential recovery
Solana experienced a sharp decline on Thursday, dropping to $192 and falling below the psychologically important $200 level. The move represents a 19% decline in just one week.
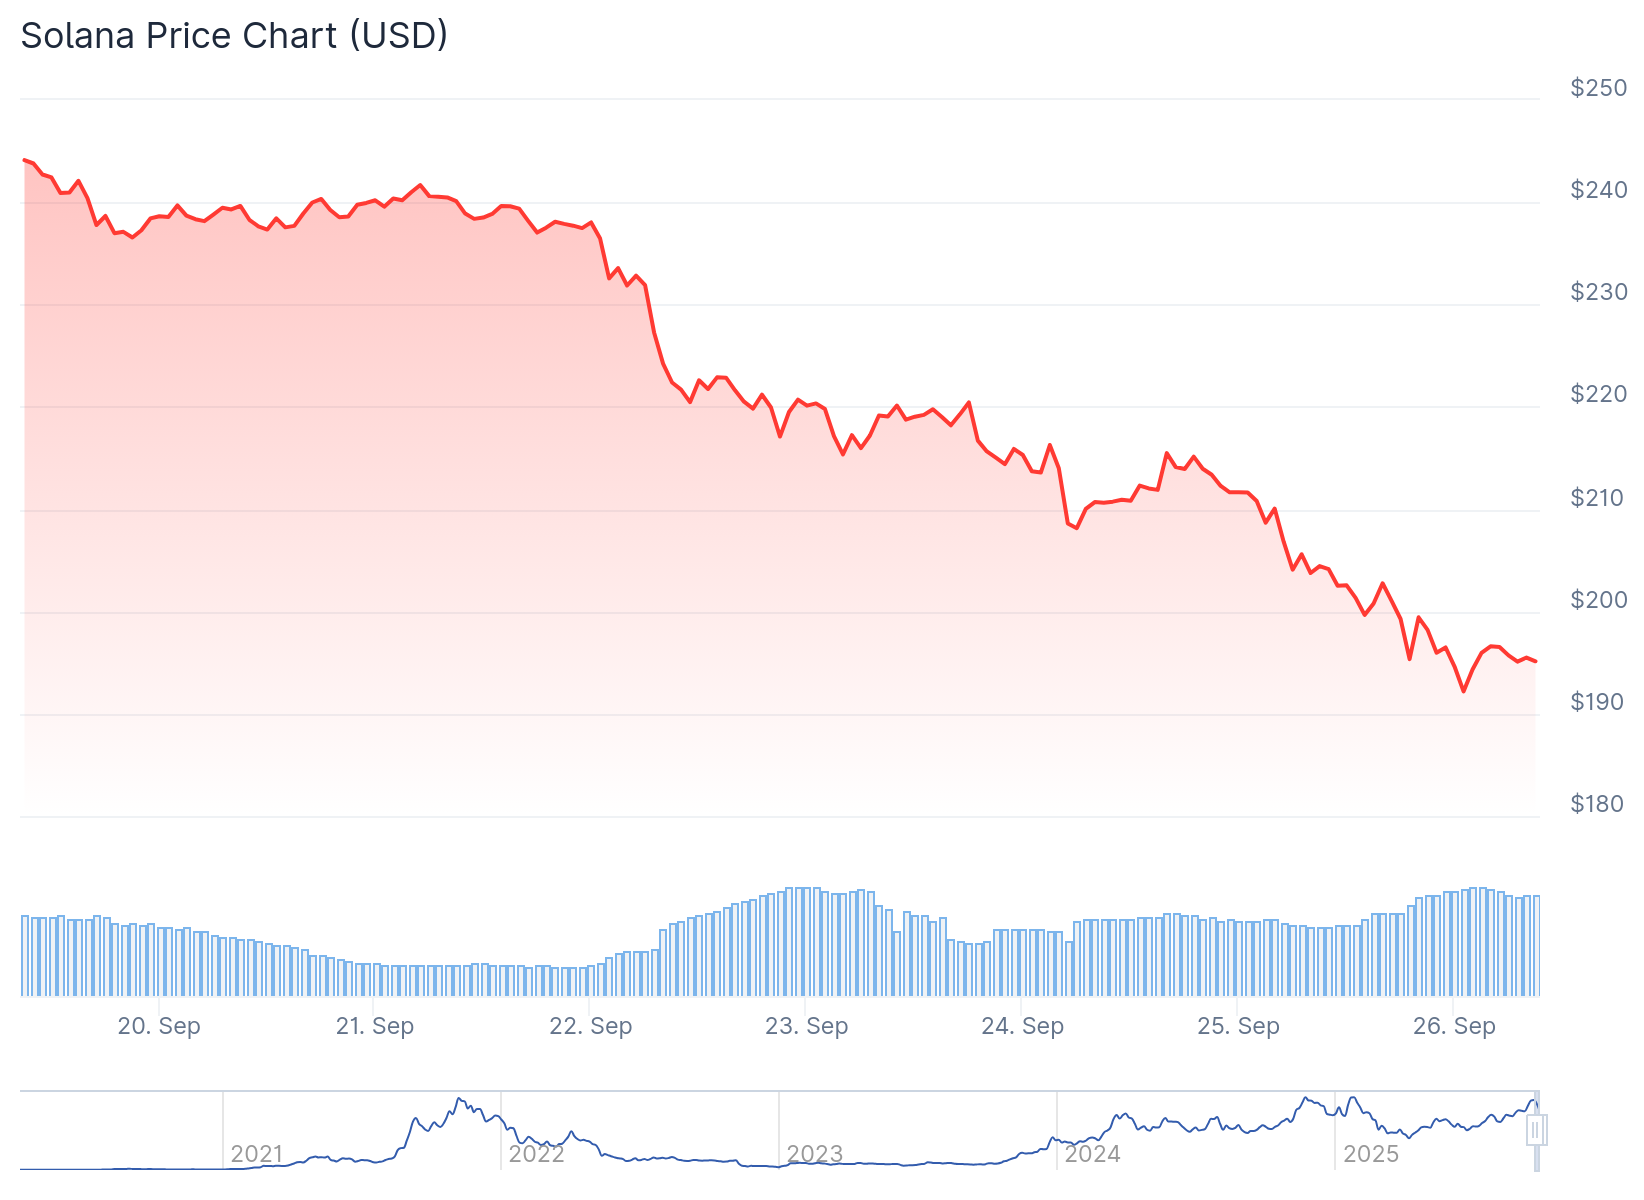
The cryptocurrency had rallied to an eight-month high of $253 before reversing course. This rapid price action has shifted market focus toward upcoming regulatory decisions and network fundamentals.
Market participants are closely watching the October 10 deadline for Grayscale’s spot SOL exchange-traded fund application. The Securities and Exchange Commission’s decision could determine whether institutional capital begins flowing into Solana.
The potential approval would mirror patterns seen with Bitcoin and Ethereum over the past year. However, Solana currently lags behind these cryptocurrencies in institutional adoption.
Institutional Ownership Gap Creates Potential
Current institutional holdings reveal a striking disparity across major cryptocurrencies. Institutions hold approximately 16% of Bitcoin’s total supply and 7% of Ethereum’s supply.
In contrast, less than 1% of SOL’s supply is institutionally owned. This gap represents potential upside if regulatory approval opens new investment channels.

Asset managers at Pantera Capital recently described SOL as “next in line for its institutional moment.” The firm pointed to under-allocation relative to market capitalization and network activity.
Companies like Stripe and PayPal have expanded their Solana integrations this year. This infrastructure development could support institutional adoption if ETF products receive approval.
Five additional ETF applications await regulatory review. Proposals from Bitwise, 21Shares, VanEck, Grayscale, and Canary face a final deadline of October 16, 2025.
Network Activity Shows Concerning Decline
On-chain metrics reveal weakening user engagement across the Solana network. Daily active addresses interacting with protocols dropped 25% this month to 3.04 million.
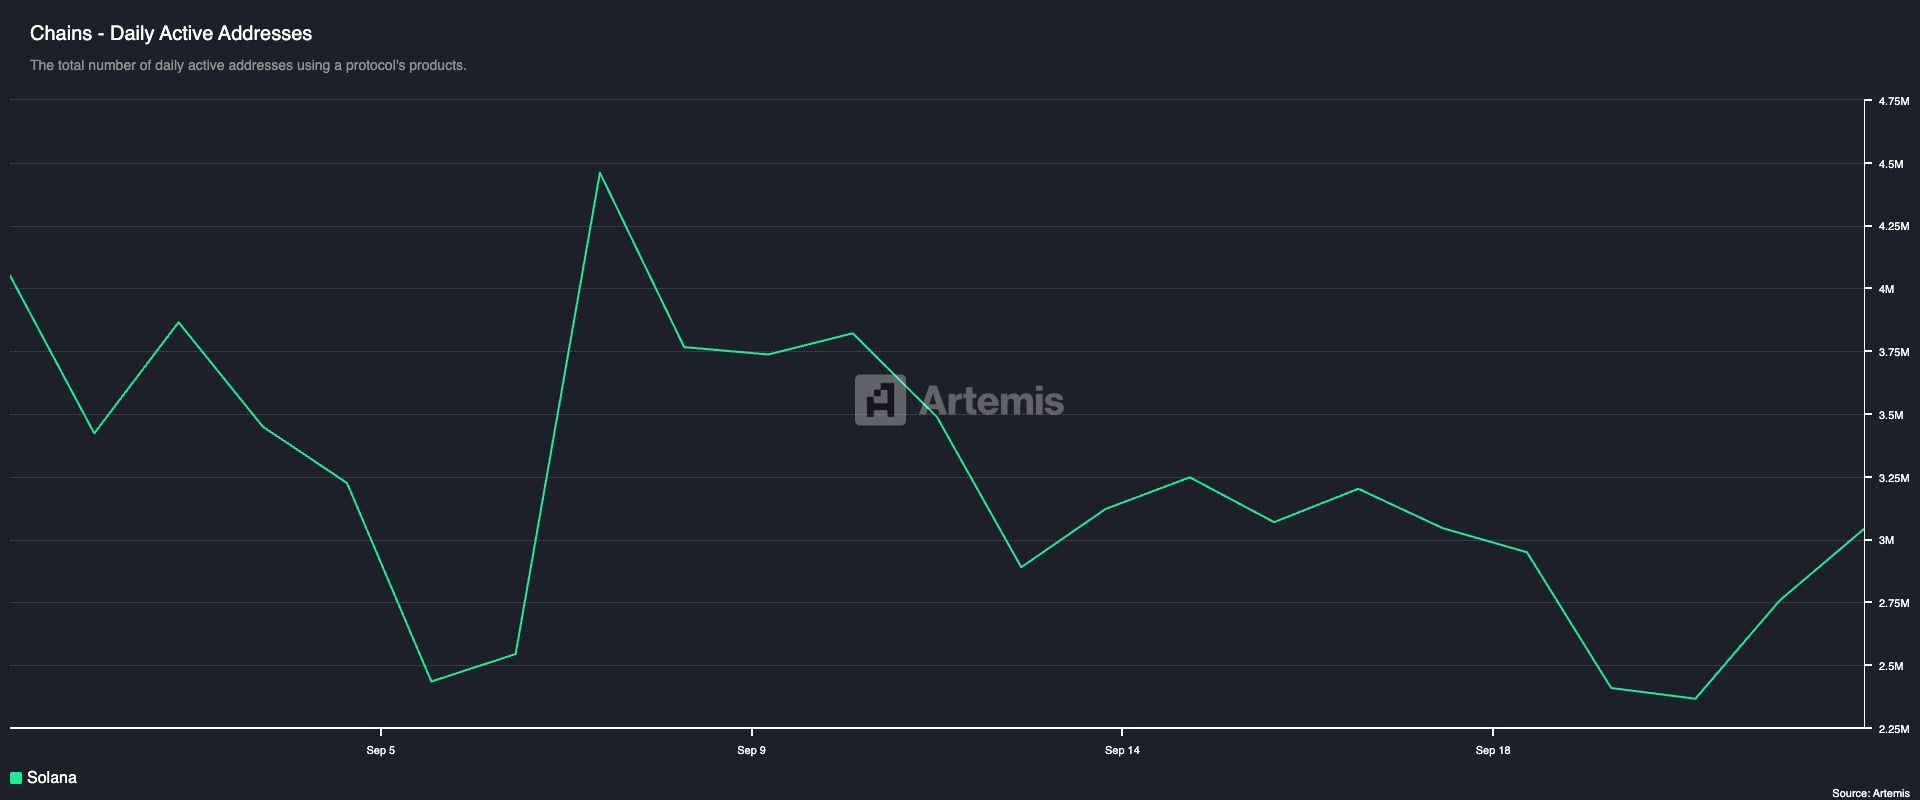
This metric represents unique wallets sending, receiving, or interacting with decentralized applications. The decline signals reduced network activity and potentially lower demand for the native token.
Historical data shows Solana typically performed well during September. The token gained 29% in 2021, followed by increases of 5.38% in 2022, 8.22% in 2023, and 12.5% in 2024.
This year appears set to break that four-year winning streak. SOL peaked at $253.51 on September 18 but has since declined approximately 17%.
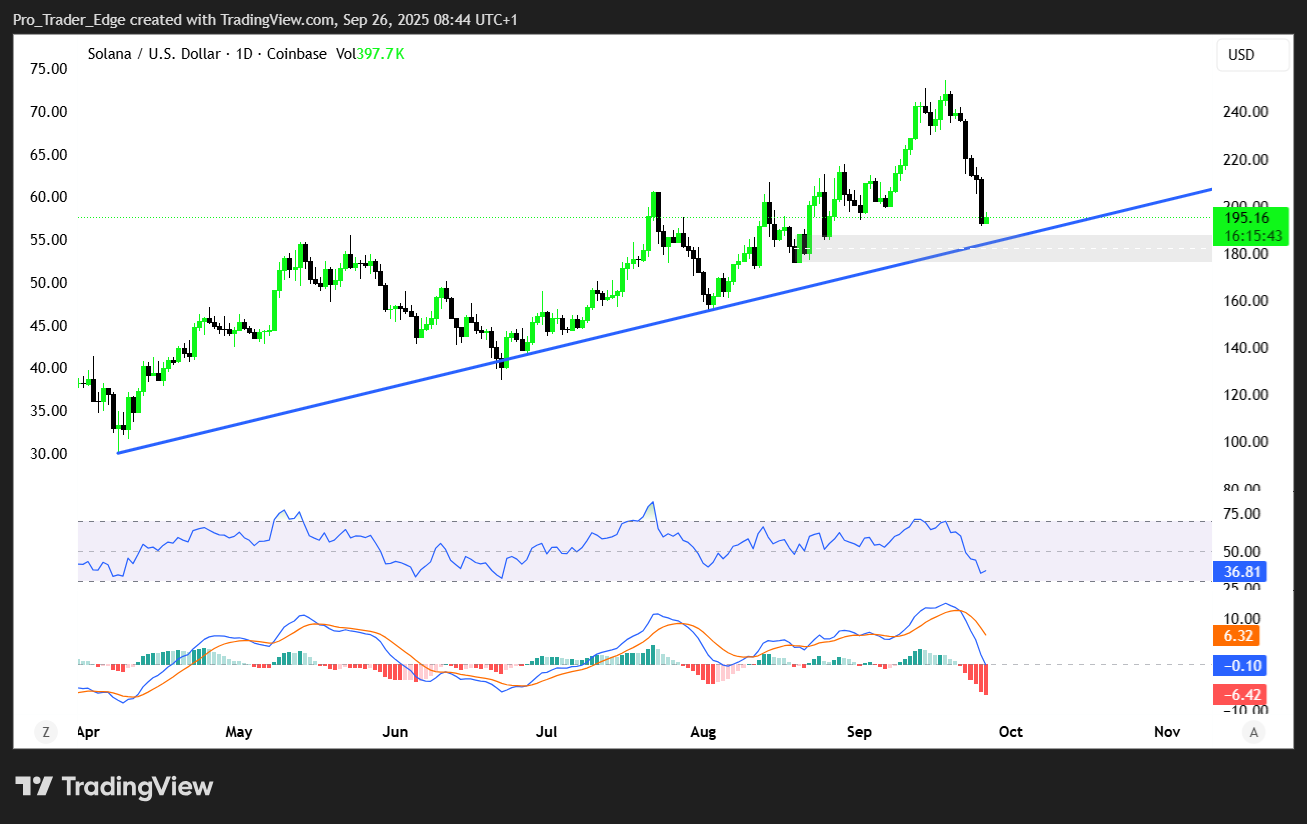
Technical analysis confirms the bearish momentum shift. The Relative Strength Index sits at 40.54 on daily charts, indicating selling pressure outweighs buying interest.
However, similar RSI readings have historically marked turning points for SOL. Since April 2025, comparable levels on shorter timeframes preceded recoveries in four out of five instances.
Price action continues to respect longer-term uptrend structures. SOL maintains a pattern of higher highs and higher lows despite the recent correction.
The current decline is testing the first major demand zone between $200 and $185. This area overlaps with key Fibonacci retracement levels that often provide technical support.
A break below $185 would shift attention to the next support zone between $170 and $156. Such a move would weaken trend strength and likely invite additional selling pressure.
Prediction markets show mixed sentiment about SOL’s near-term prospects. Polymarket currently assigns just a 41% probability of the token reaching new all-time highs in 2025.
The October ETF decision timeline approaches as SOL tests critical support levels at $195.55, with potential further declines to $171.88 if bearish pressure continues through month-end.
Get 3 Free Stock Ebooks
Discover top-performing stocks in AI, Crypto, and Technology with expert analysis.
- Top 10 AI Stocks - Leading AI companies
- Top 10 Crypto Stocks - Blockchain leaders
- Top 10 Tech Stocks - Tech giants

