
 Price: Critical $87 Support Level in Focus as RWA Market Surges Past $1.8B")
Key Highlights
- Solana maintains position around $88, defending crucial trend line support following retreat from $95 peak
- Market sentiment gauge plunged to 30 (Fear territory) from neutral after Fed Chair Powell’s remarks on Iran conflict economic implications
- Network activity exceeded 880 million transactions in the past week, yet weekly fee generation remains modest at $4.6 million
- The platform’s real-world asset sector has crossed $1.82 billion in tokenized assets, while RWA-focused DeFi protocols reached $465 million TVL
- Market observers identify the $50–$80 zone as a strategic accumulation area, projecting potential targets ranging from $500 to $1,000
Solana continues to trade in the $88 vicinity following its retreat from recent highs of $95. The digital asset is currently defending a critical trend line support level that market participants are monitoring with heightened attention.
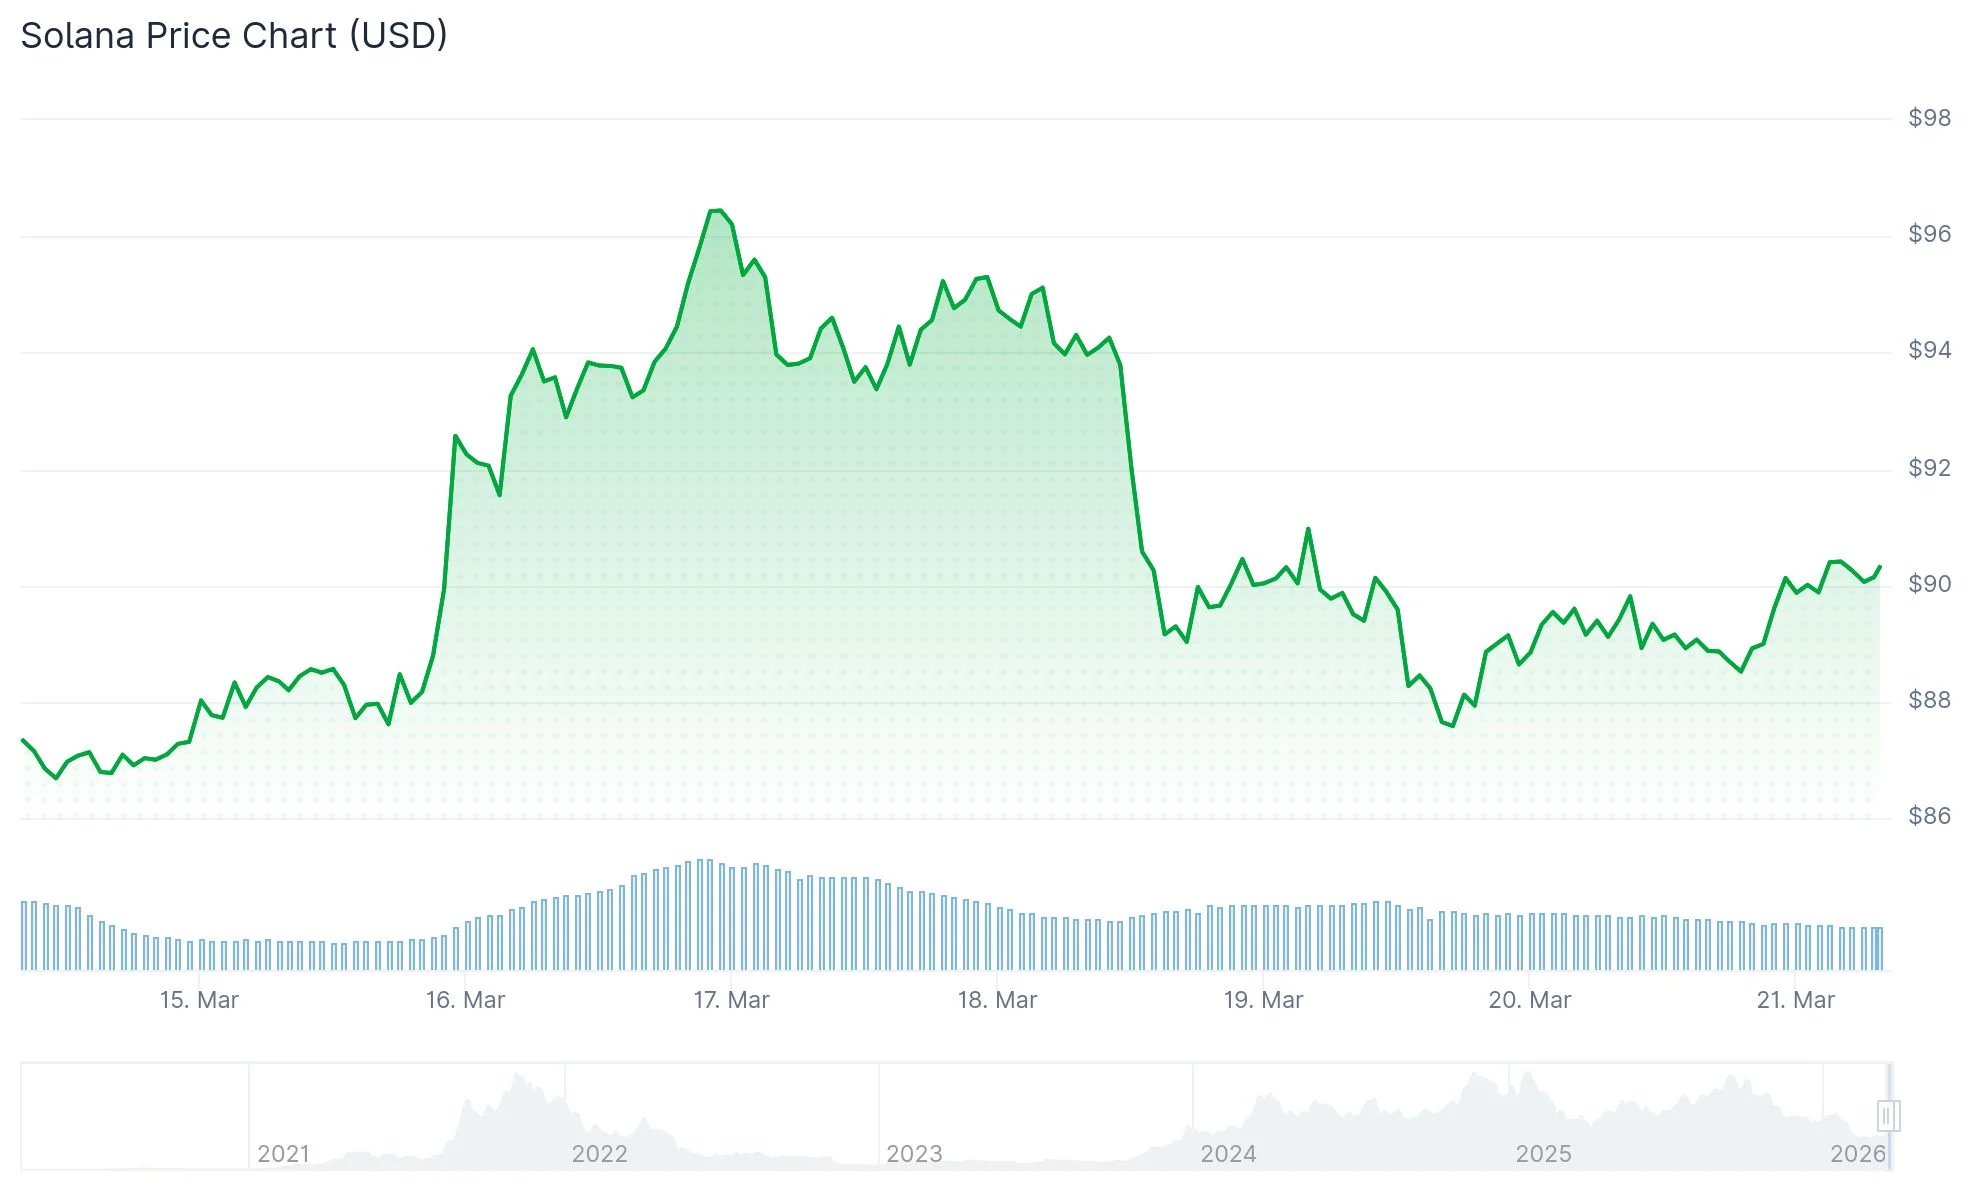
Daily trading activity has declined to approximately $3.3 billion, representing a significant decrease from the $6.5 billion recorded on March 16 when SOL momentarily reached $95. Evidence suggests that bullish traders are securing gains during upward movements as overall cryptocurrency market confidence becomes more reserved.
The cryptocurrency market sentiment indicator dropped from 46 (Neutral territory) to 30 (Fear zone) following Federal Reserve Chairman Jerome Powell’s statement regarding the “uncertain” economic consequences stemming from the Iran conflict. Rising oil costs could trigger increased inflation, potentially forcing the Fed to postpone or eliminate planned interest rate reductions this year.
Transaction Volume Versus Revenue Generation
The Solana network handled more than 880 million transactions over the previous seven-day period. This figure approaches its all-time peak of 959 million transactions recorded during the week concluding February 8.
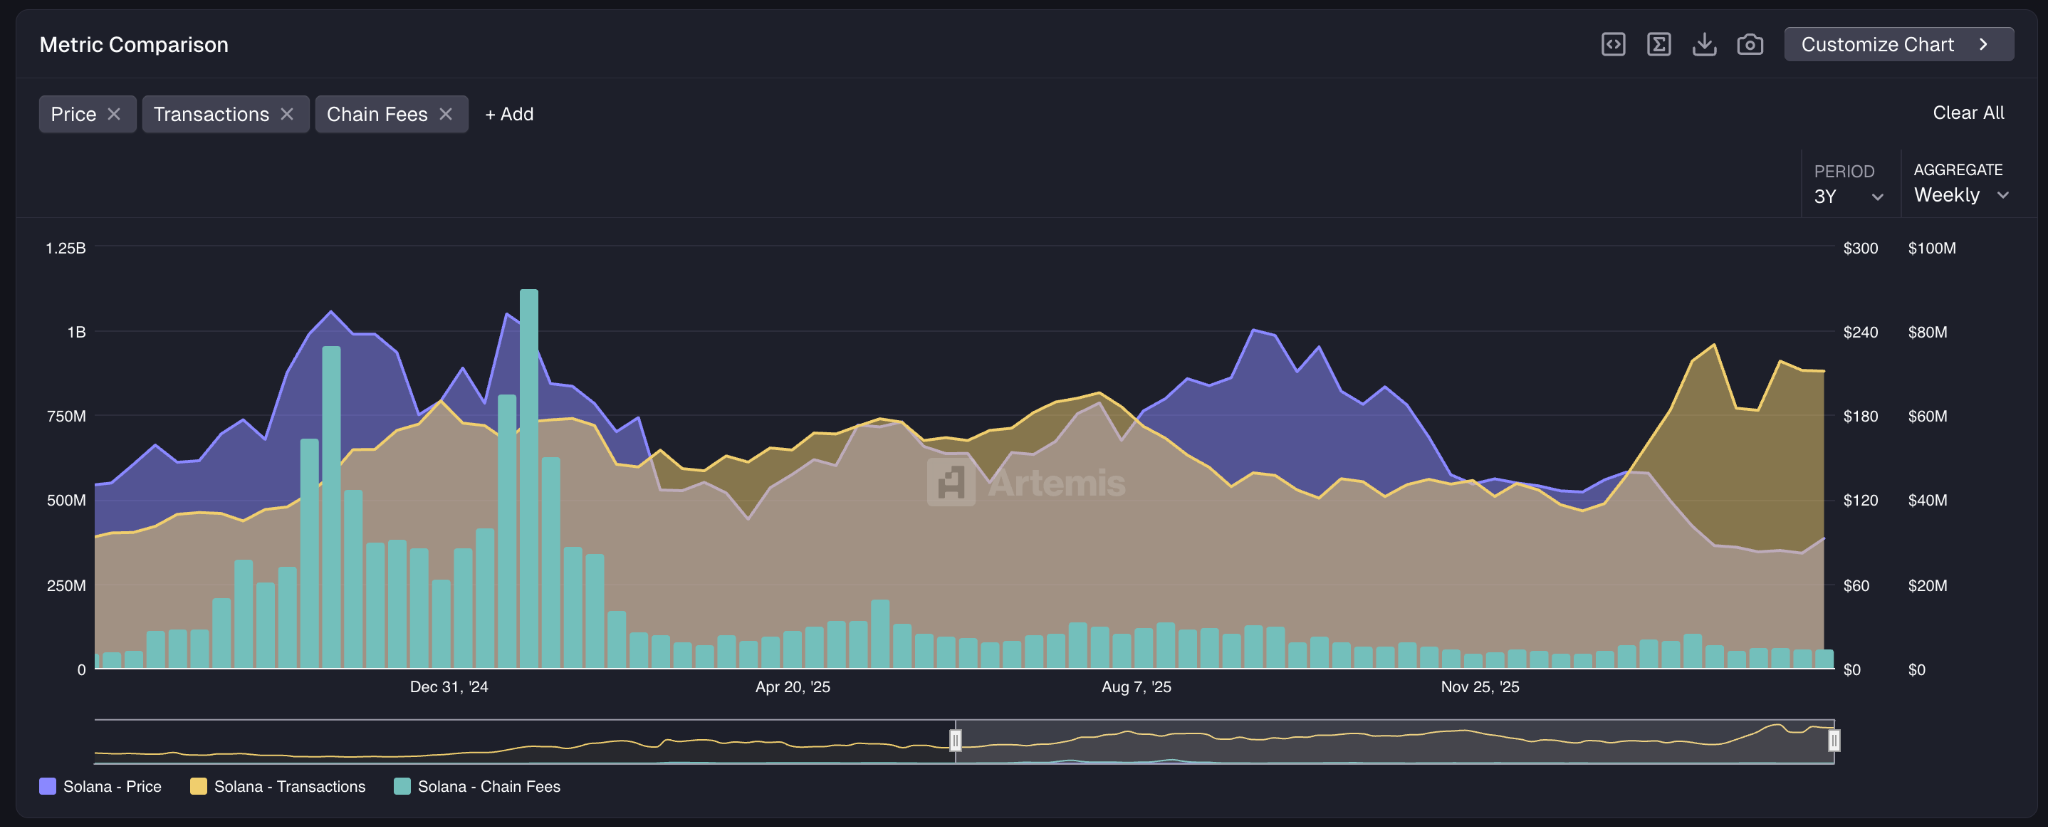
Despite the impressive transaction throughput, the network generated only $4.6 million in fees during the same timeframe. This represents a 50% reduction compared to fee collection during the June–September 2025 price surge, when transaction volumes actually registered lower at 700–800 million weekly.

Reduced fee generation typically suggests diminished network valuation. Market analysts interpret the existing disparity between transaction throughput and fee income as a concerning indicator for medium-term price action.
From a technical perspective, SOL encounters significant resistance at the $87 threshold. A decisive breakdown beneath this support could push the token toward $77, representing an 11.5% downward move. Conversely, if this level holds firm and substantial volume emerges during U.S. market hours, it could catalyze a recovery attempt toward the $100 mark.
Real-World Asset Sector Surpasses $1.82 Billion
Solana’s real-world asset infrastructure surpassed $1.82 billion in tokenized value on March 20. This encompasses tokenized debt instruments, equity securities, and investment funds migrated onto the blockchain.
DeFi protocols backed by real-world assets on Solana achieved a record $465 million in total value locked. Although Solana remains second to Ethereum in aggregate RWA market capitalization, its footprint in this sector continues expanding.
Cryptocurrency analyst Crypto Patel shared via X that the monthly timeframe chart demonstrates a validated breakout pattern, successful support retest, and robust support maintenance. Patel emphasized that Fibonacci retracement zones are properly established and identified the $50–$80 band as an exceptional accumulation opportunity. Drawing on historical cycle analysis, Patel projected SOL could achieve $500–$1,000 valuations if previous market patterns materialize again.
SOL currently hovers around $88, with the $87 support threshold serving as the critical decision point for immediate price direction.
Get 3 Free Stock Ebooks
Discover top-performing stocks in AI, Crypto, and Technology with expert analysis.
- Top 10 AI Stocks - Leading AI companies
- Top 10 Crypto Stocks - Blockchain leaders
- Top 10 Tech Stocks - Tech giants

