
 Price: Major Whales Loading Up as $92 Resistance Looms — Rally Incoming?")
TLDR
- SOL has remained confined within a $78–$90 corridor for almost four weeks, forming what appears to be a classic accumulation zone.
- Transaction volumes on the network increased 19.1% week-over-week, while trading volumes surged from $22B to $34B.
- Solana-based spot ETFs attracted $18.44 million over a two-day span this week, adding to the previous week’s $44.44 million.
- Breaking decisively above the $90–$92 zone could unlock a path toward $100, followed by $137 at the 200-day EMA.
- Failure to hold $78 support may trigger a pullback toward the $67 level.
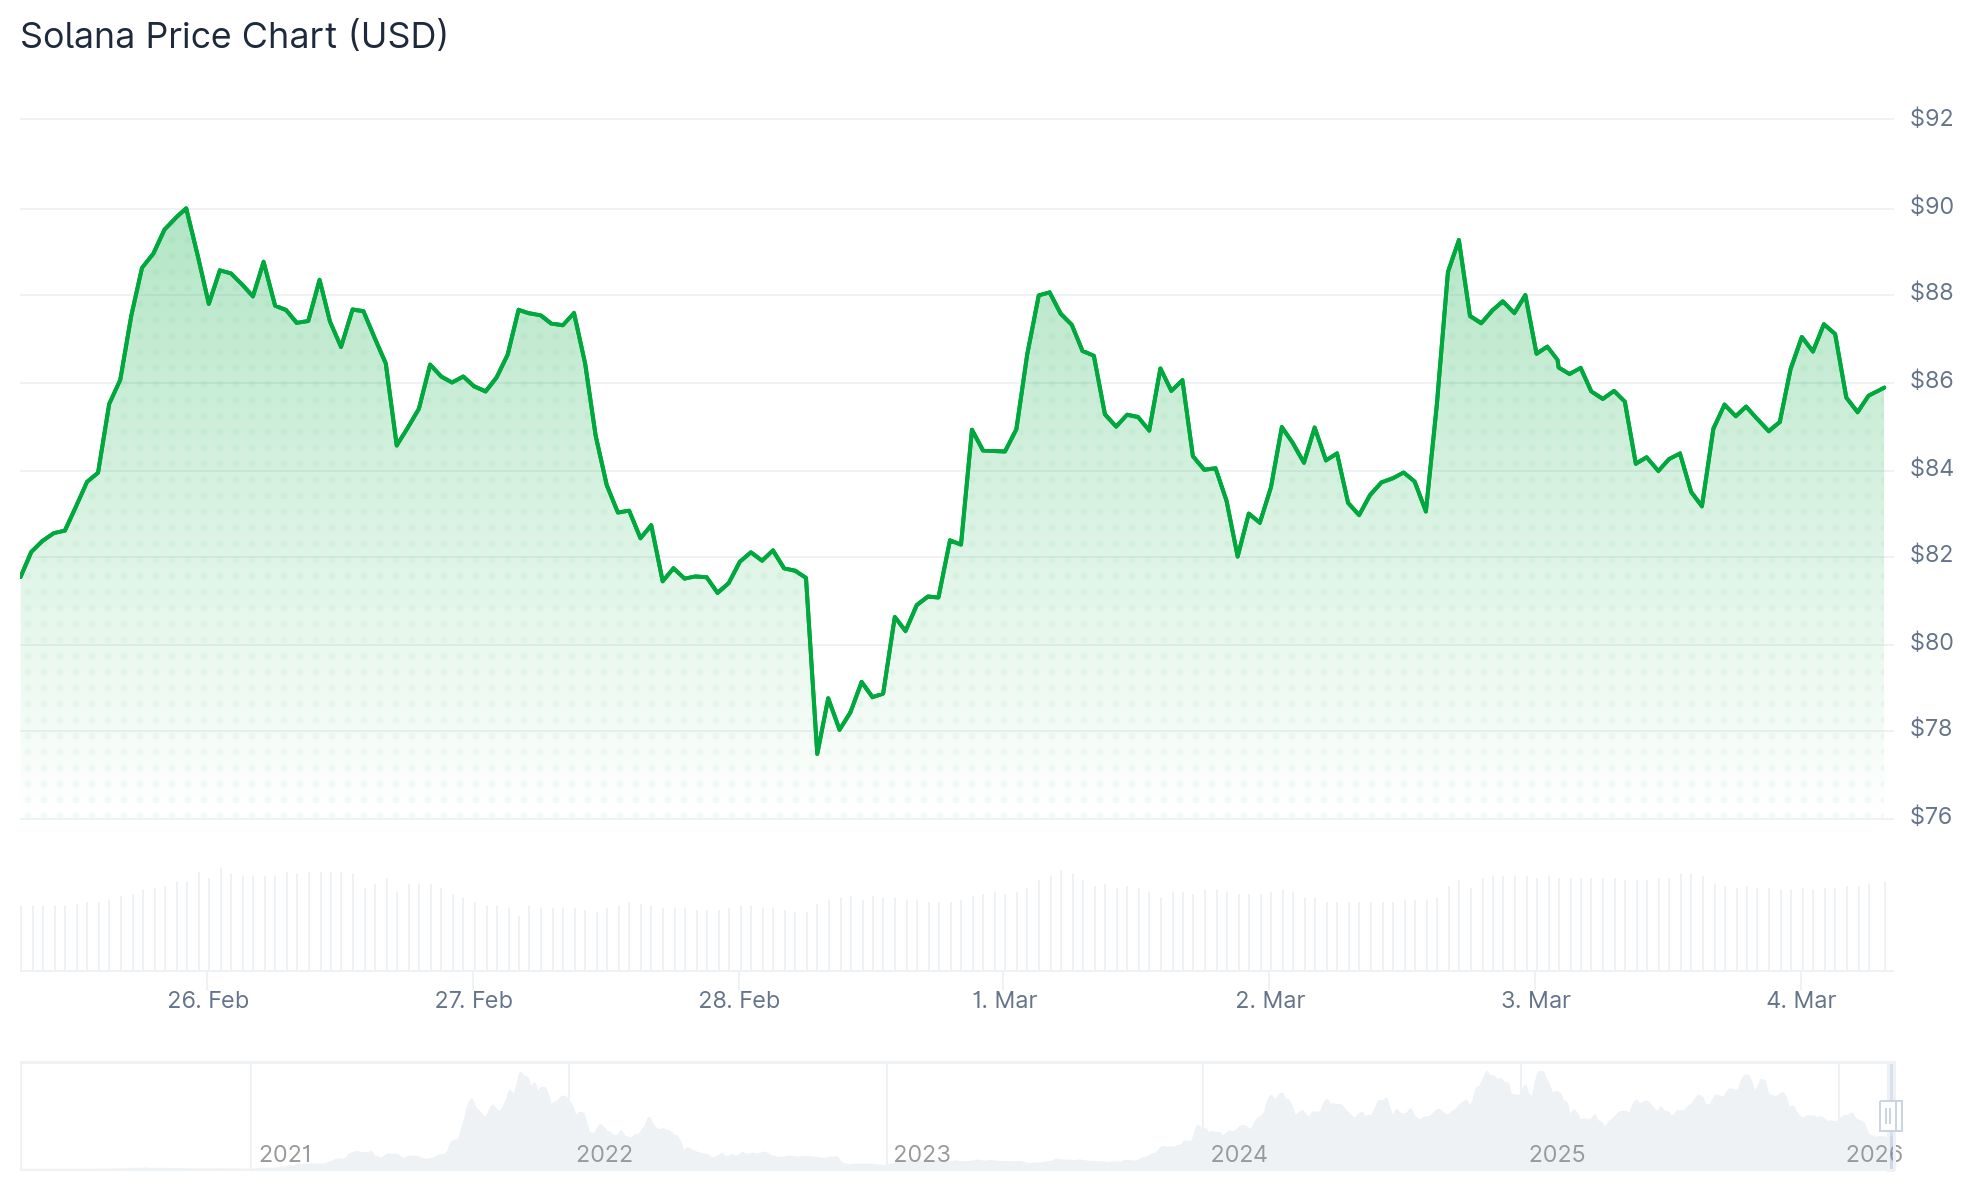
For nearly a month, Solana has remained trapped in a narrow trading corridor between $78 and $90. The standoff between buyers and sellers has resulted in a classic consolidation pattern.
Large-scale investors have been notably active throughout this range — accumulating near the $78 floor and distributing around $90. This cyclical behavior has repeated several times since mid-February.
On February 12, SOL defended the $78 level and rallied back to $90 in just three days. An identical scenario unfolded again on February 24.
Currently, SOL is hovering around $85 after approaching $88 before experiencing a modest retracement.
The asset remains underneath the upper boundary of its parallel channel at $87.96, which continues to serve as near-term resistance.

Network Activity Shows Momentum
Blockchain analytics from Artemis reveal that weekly transaction counts jumped from 764 million to 910 million — representing a substantial 19.1% weekly gain.
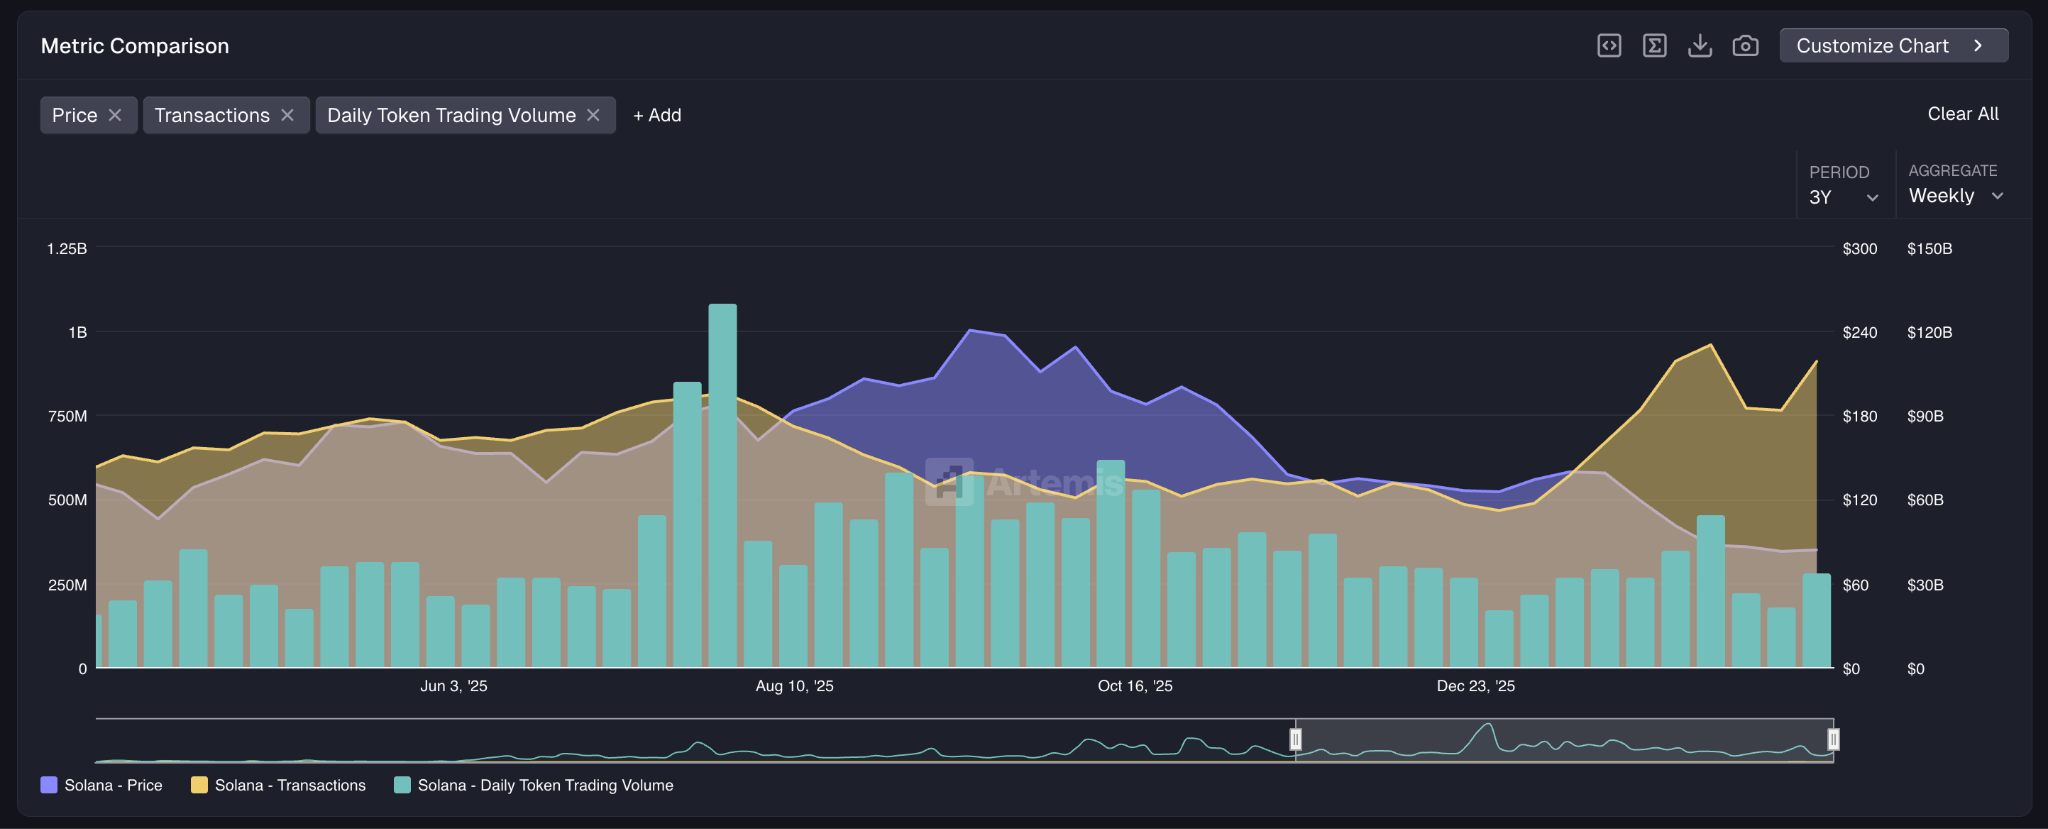
Active wallet addresses also climbed higher, approaching a 2026 record for this particular metric.
SOL’s weekly trading volume exploded from $22 billion to $34 billion, indicating growing demand as the price continuously retests the $78 support zone.
Institutional Capital Flows Through ETF Channels
Spot Solana ETF products registered $1.03 million in net inflows on Tuesday, building on the previous day’s $17.41 million — totaling $18.44 million across two sessions.
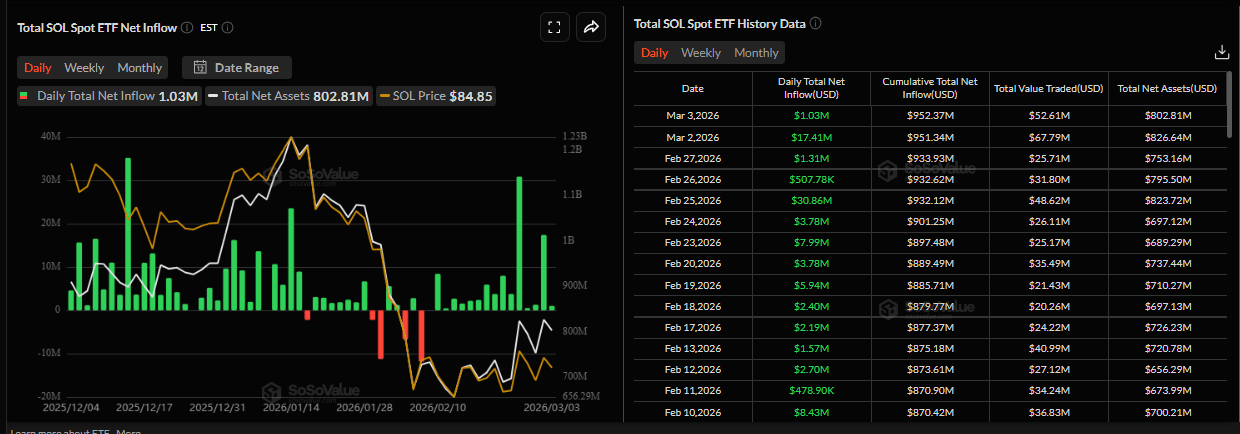
The preceding week witnessed $44.44 million flowing into these ETF products, marking the strongest weekly performance since mid-January.
Funding rates across derivatives platforms turned positive on Wednesday at 0.0008%, indicating growing bullish positioning among traders.
The daily Relative Strength Index has climbed back toward the mid-40s after touching oversold territory, while the MACD indicator maintains positive momentum.
Immediate overhead resistance appears at the 23.6% Fibonacci retracement level of $86.60, with the 38.2% retracement at $98.42 aligning with the 50-day EMA.
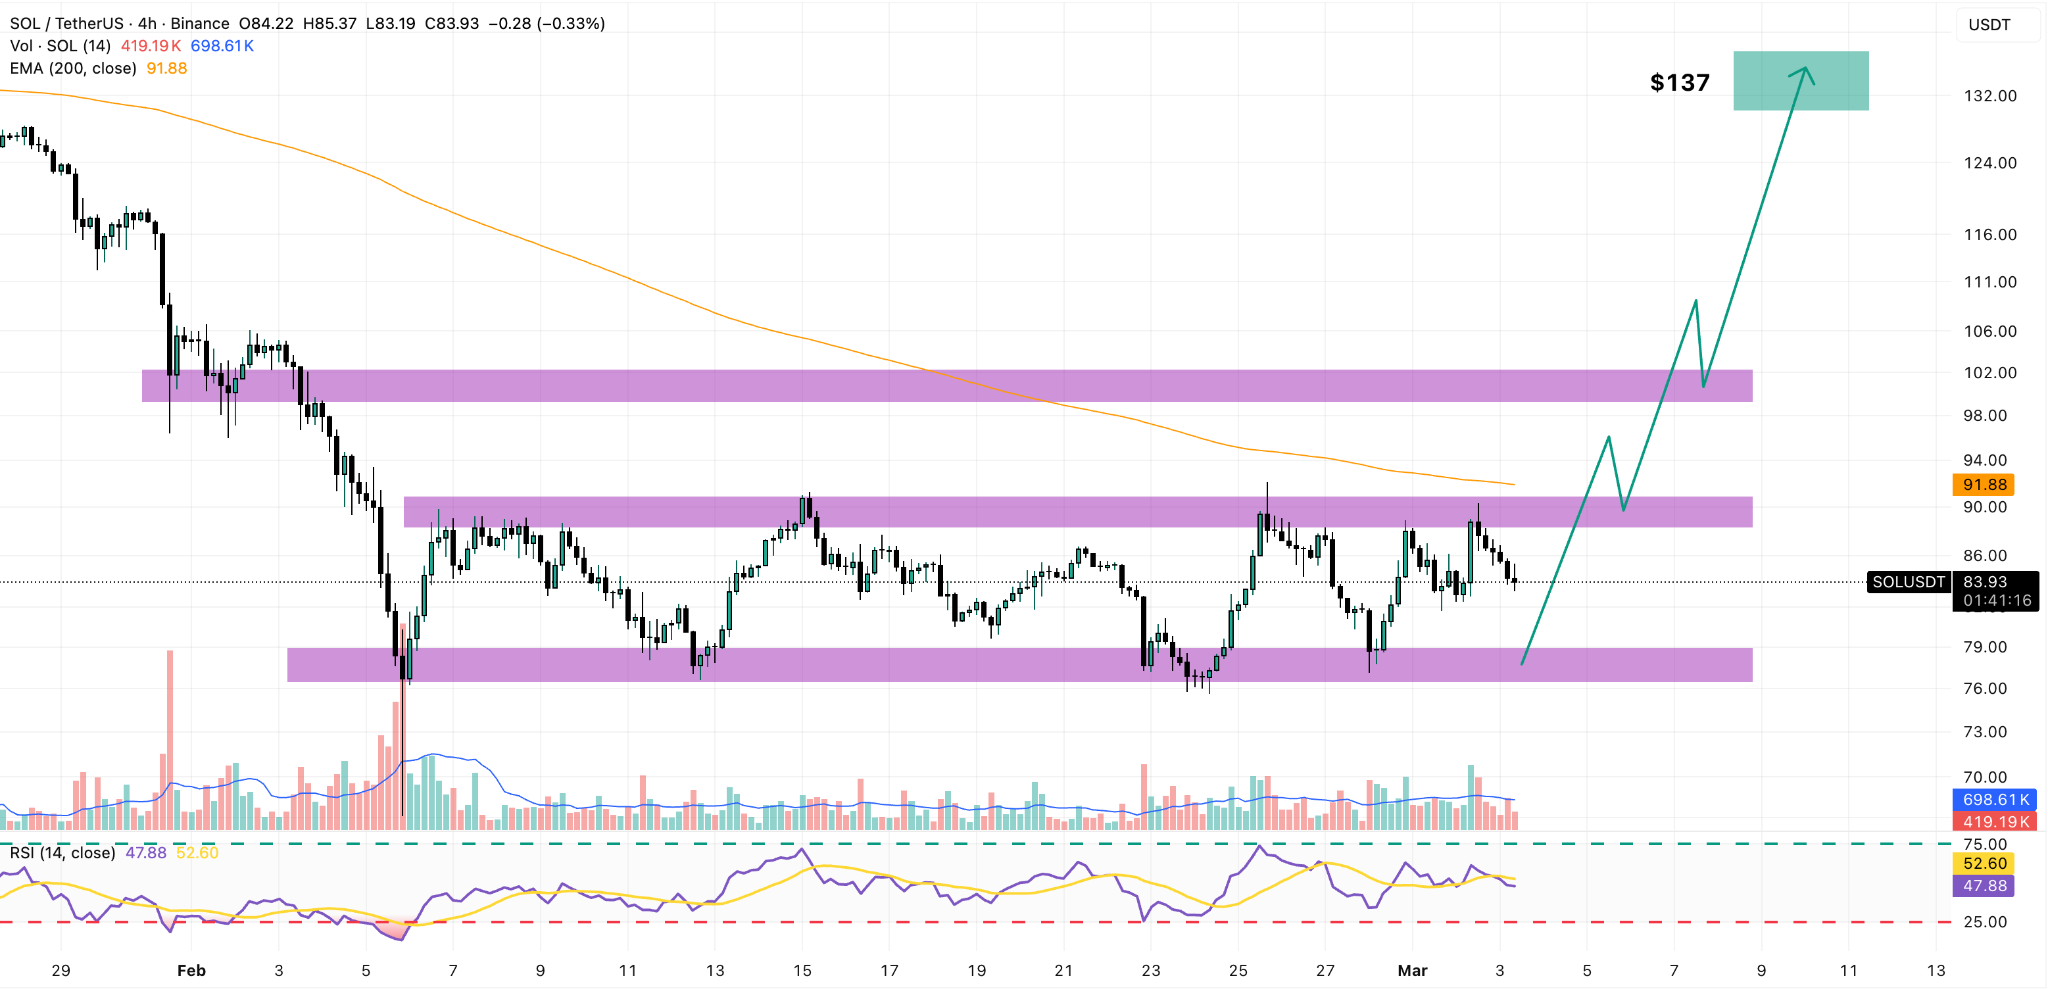
A sustained move above $92 would bring $106 into focus, and clearing that hurdle could establish $120 as the next logical target.
The 200-period daily EMA is positioned at $137 — representing a potential 63% gain from present levels if SOL manages a confirmed breakout.
On the support side, initial protection rests at $77.60, with a secondary floor at the prior swing low of $67.50.
Market analysts view $80 as a pivotal threshold — losing that level would likely send Solana tumbling toward $75 or potentially $70.
Two recent buy signals on shorter timeframes both activated near $78 and reached the $90 objective, delivering returns of 4.4x and 2.3x respectively.
SOL has posted a 9.3% gain over the trailing seven-day period, outperforming all other top-five cryptocurrencies during this timeframe.
Get 3 Free Stock Ebooks
Discover top-performing stocks in AI, Crypto, and Technology with expert analysis.
- Top 10 AI Stocks - Leading AI companies
- Top 10 Crypto Stocks - Blockchain leaders
- Top 10 Tech Stocks - Tech giants

