
 Price Prediction: $210 Rally Hits Wall as Smart Money Takes Profit")
TLDR
- Solana price prediction shows recovery from $194 support to $210 but struggling at $212 resistance
- NUPL indicator at 0.30 matches levels that triggered 4-8% corrections in previous months
- Long-term holders selling over 1.5 million SOL tokens despite 30% monthly price gains
- Technical analysis points to $218-$232 upside targets if $212 breaks, or $194-$184 downside risk
- Money Flow Index divergence suggests weakening buyer demand at current price levels
Solana has recovered from recent lows near $194 to trade above $210. The cryptocurrency shows a monthly gain of 30% but faces technical challenges at key resistance levels.
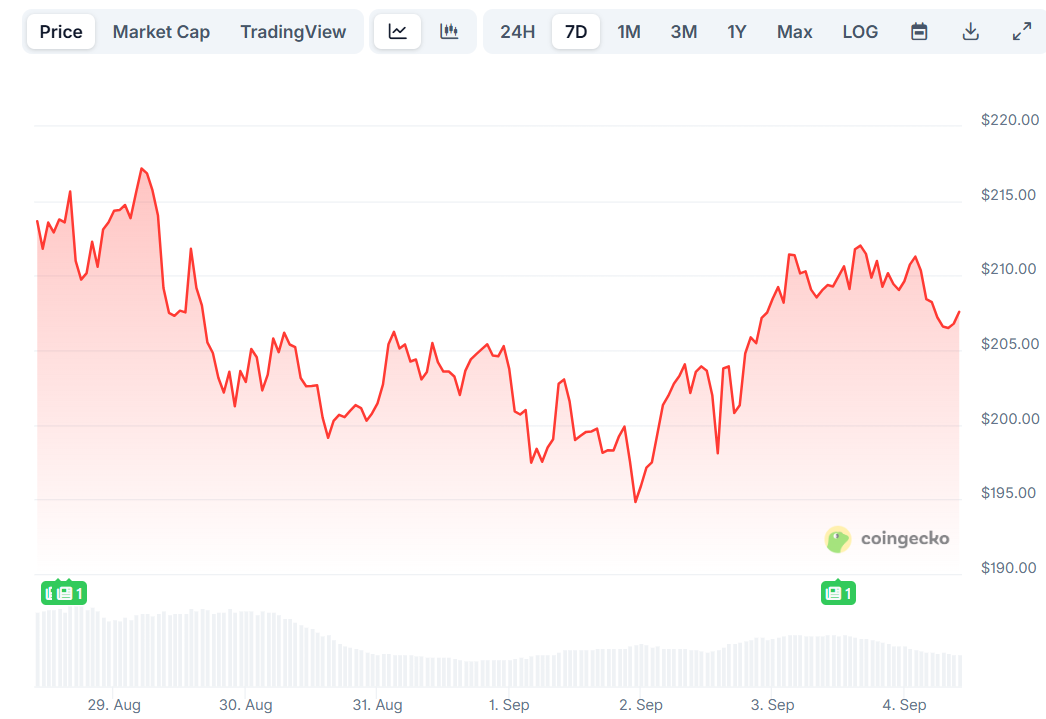
The price action demonstrates typical consolidation patterns after strong moves. SOL cleared the $200 psychological level and broke above the 100-hourly moving average during the recovery phase.
Technical indicators show mixed signals for the near-term outlook. The hourly MACD is losing momentum in bullish territory while the RSI dropped below 50.
A connecting bullish trend line with support at $207 was broken during recent trading. This breakdown suggests some weakening in the immediate upward momentum.
The 50% Fibonacci retracement level from the $218 high to $194 low was successfully cleared. However, bears have emerged at the 76.4% retracement level near $212.
On-Chain Metrics Flash Warning Signs
Net Unrealized Profit/Loss data shows concerning parallels to previous correction periods. The NUPL reading climbed from 0.26 to 0.30, reaching levels that preceded selloffs in August.

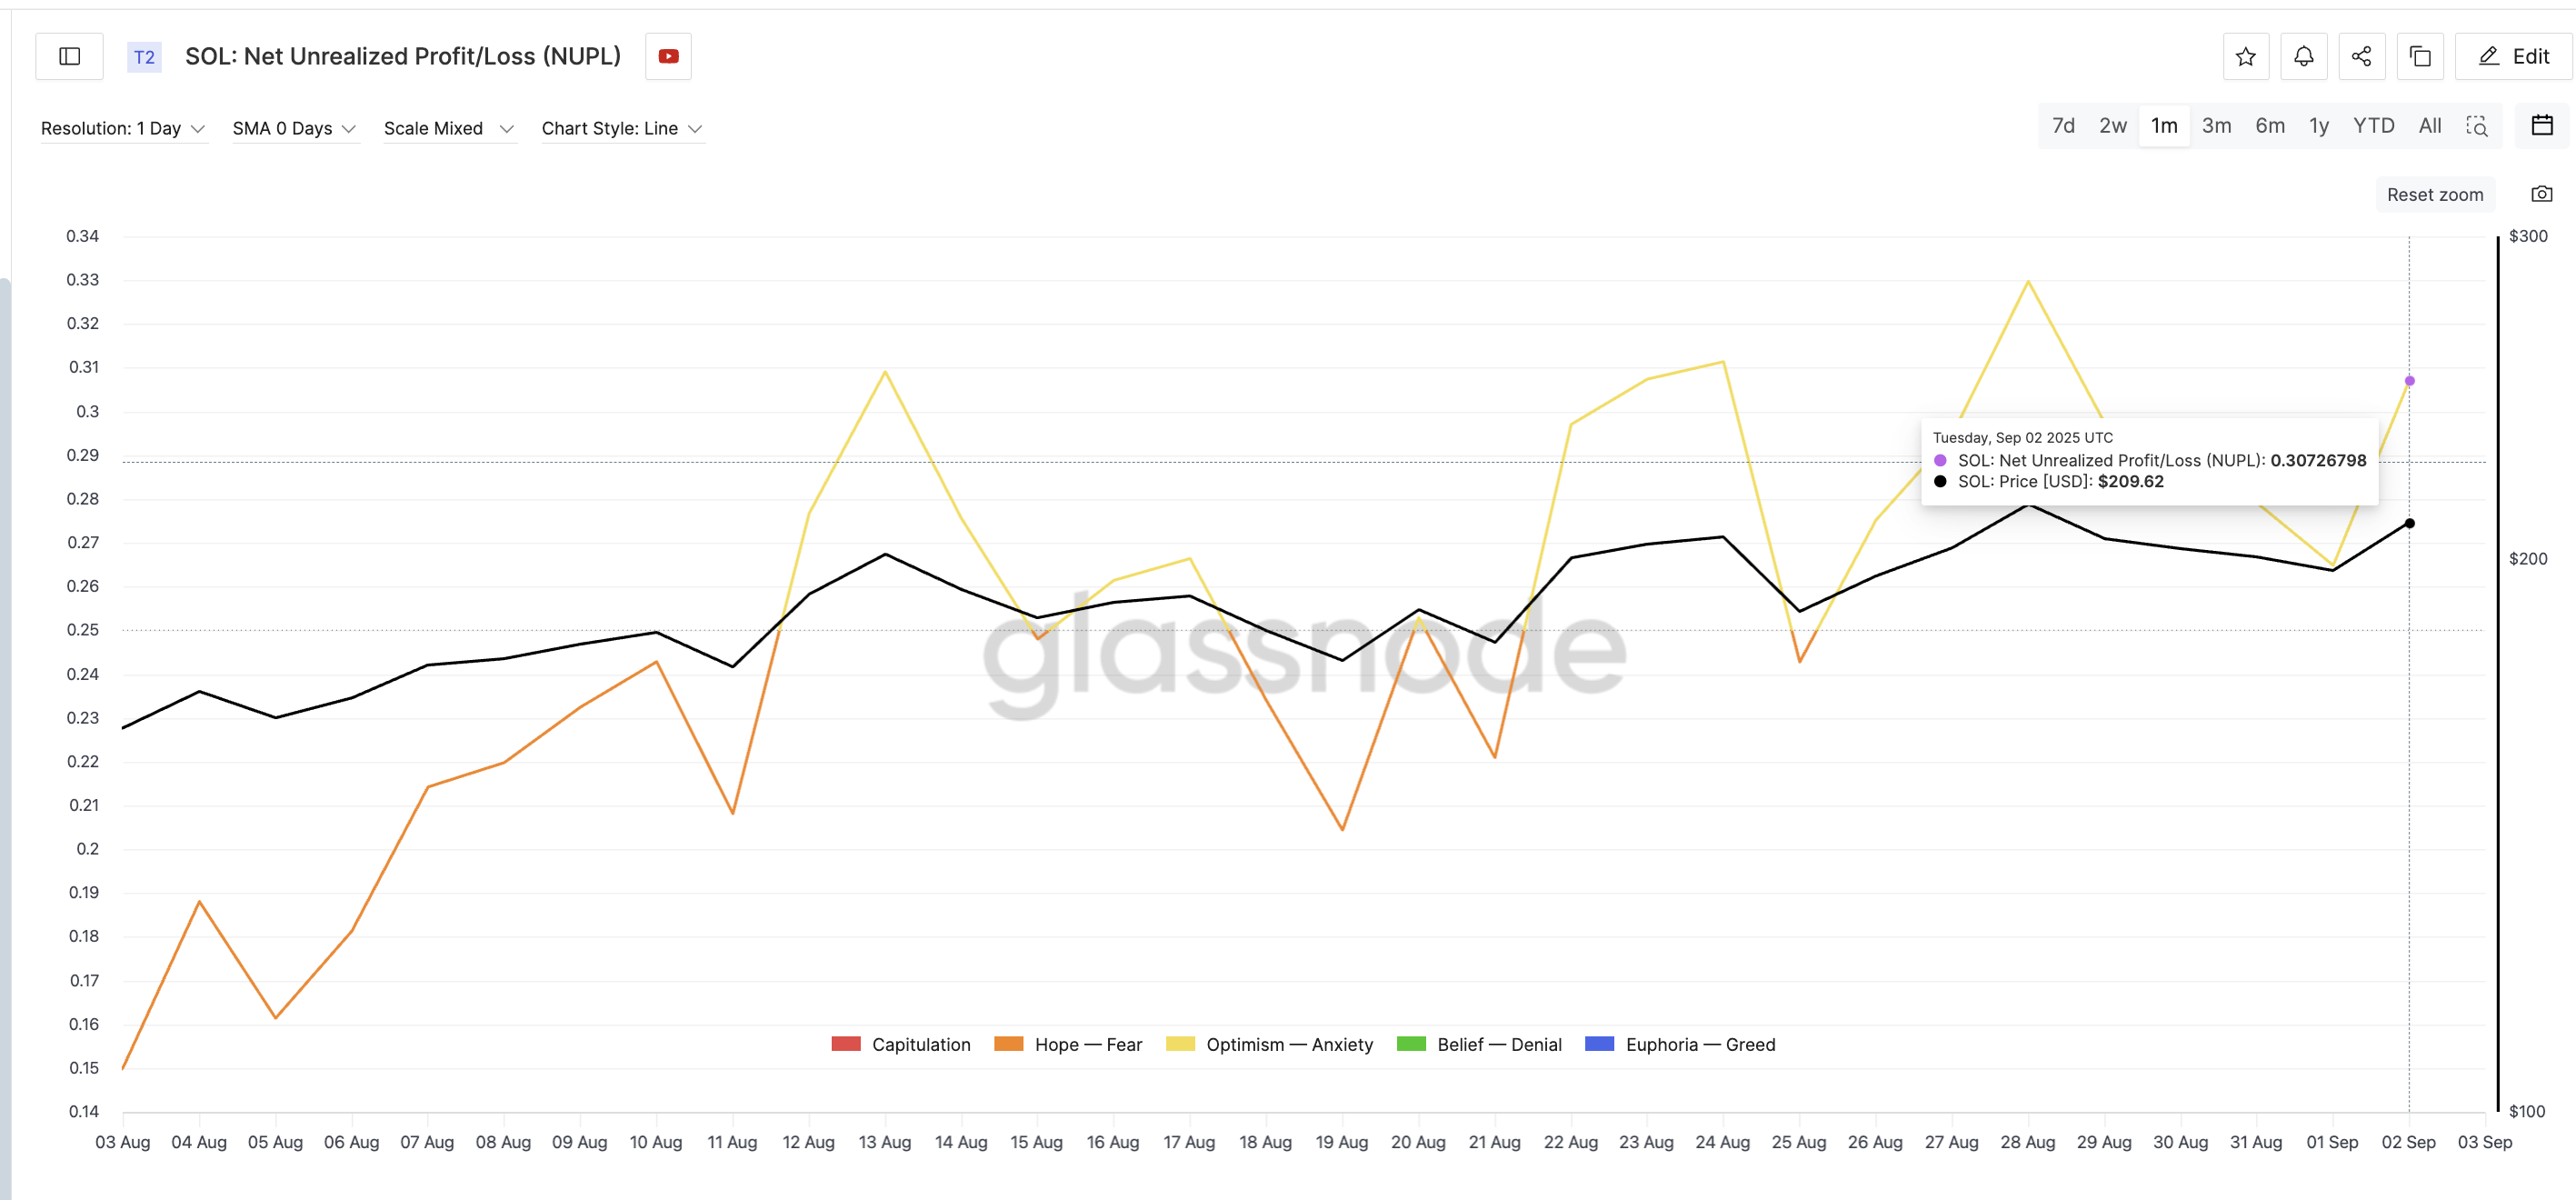
Historical patterns show NUPL peaks at 0.30 have coincided with price corrections. On August 28, a similar NUPL reading preceded a drop from $214 to $205.
Another instance occurred on August 13 when NUPL reached 0.30, followed by an 8% price decline. The current reading suggests profit-taking pressure may be building again.
Long-term holder behavior reinforces these concerns. The Hodler Net Position Change metric dropped below -1.5 million SOL, indicating sustained selling from experienced investors.
This negative reading shows smart money reducing exposure despite rising prices. Previous instances of negative hodler flows have coincided with price weakness.
The Money Flow Index adds another layer of caution. While MFI initially rose with the price bounce, it has since declined even as prices held elevated levels.
Solana Price Prediction
Price prediction models point to key levels ahead. Immediate resistance sits at $212, with a break potentially targeting $218 and then $232.
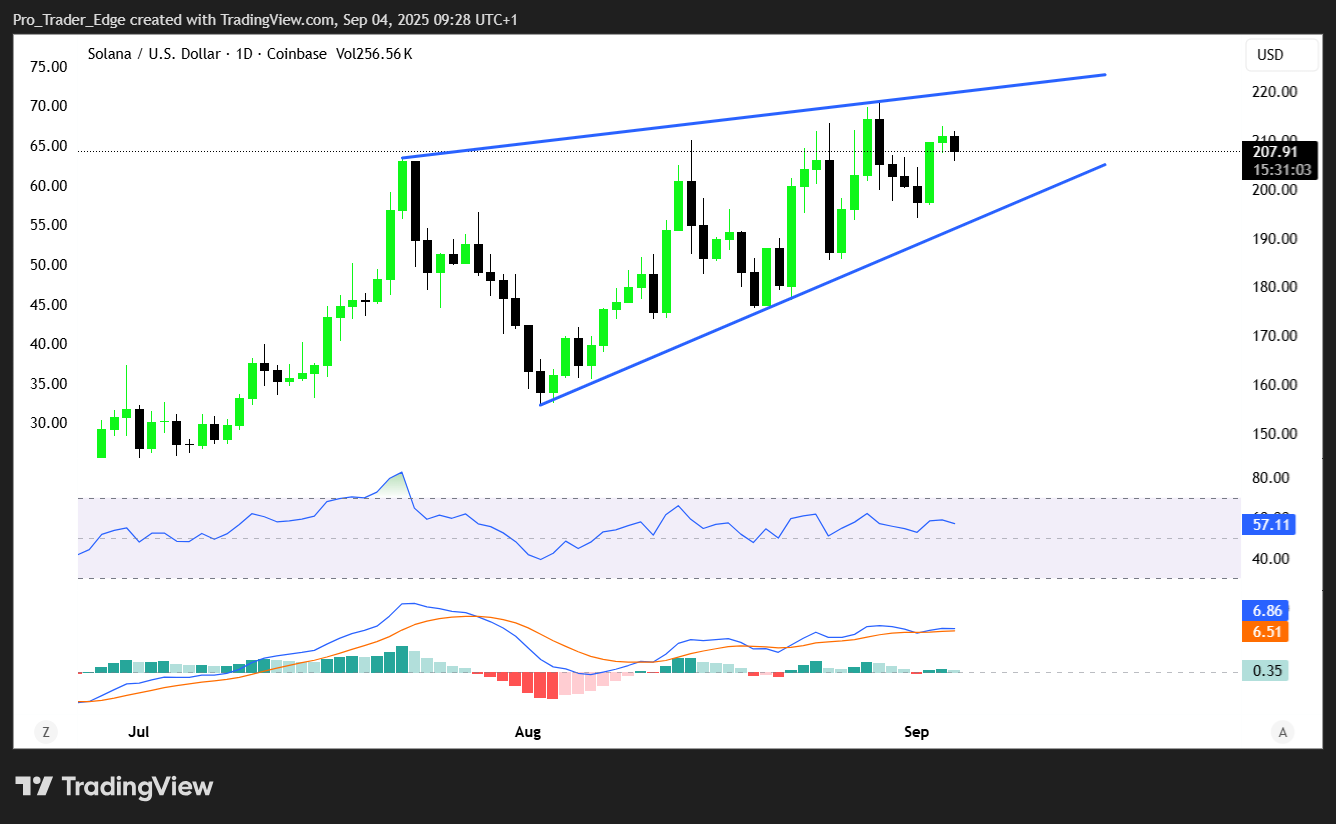
A successful close above $218 could open the path to $245. These levels represent the upper bounds of the current trading range expectations.
Downside risks center on the $200 support level. A break below this psychological barrier could trigger moves toward $195 and potentially $184.
The $194 zone represents strong support based on recent price action. This level has provided a foundation for the current recovery attempt.
Current price action suggests a range-bound environment between $200 and $215. Breaking either boundary would provide direction for the next move.
SOL trades at $210 with resistance at $212 and support at $200.
Get 3 Free Stock Ebooks
Discover top-performing stocks in AI, Crypto, and Technology with expert analysis.
- Top 10 AI Stocks - Leading AI companies
- Top 10 Crypto Stocks - Blockchain leaders
- Top 10 Tech Stocks - Tech giants

