
 Price Prediction: Will September Finally Trigger the $500 Rally?")
TLDR
- Solana price tests $213 resistance as whales resume aggressive accumulation
- 504-day consolidation period matches historical fractal patterns before major rallies
- Folius Ventures adds $600K through institutional dollar-cost averaging strategies
- Technical analysis shows SOL defending $197 support with RSI near neutral levels
- Breakout targets include $240-$250 range with longer-term $500 cycle projections
Solana price action remains focused on the critical $213 resistance level as September trading begins. The cryptocurrency has attracted renewed whale interest with large holders resuming accumulation strategies.
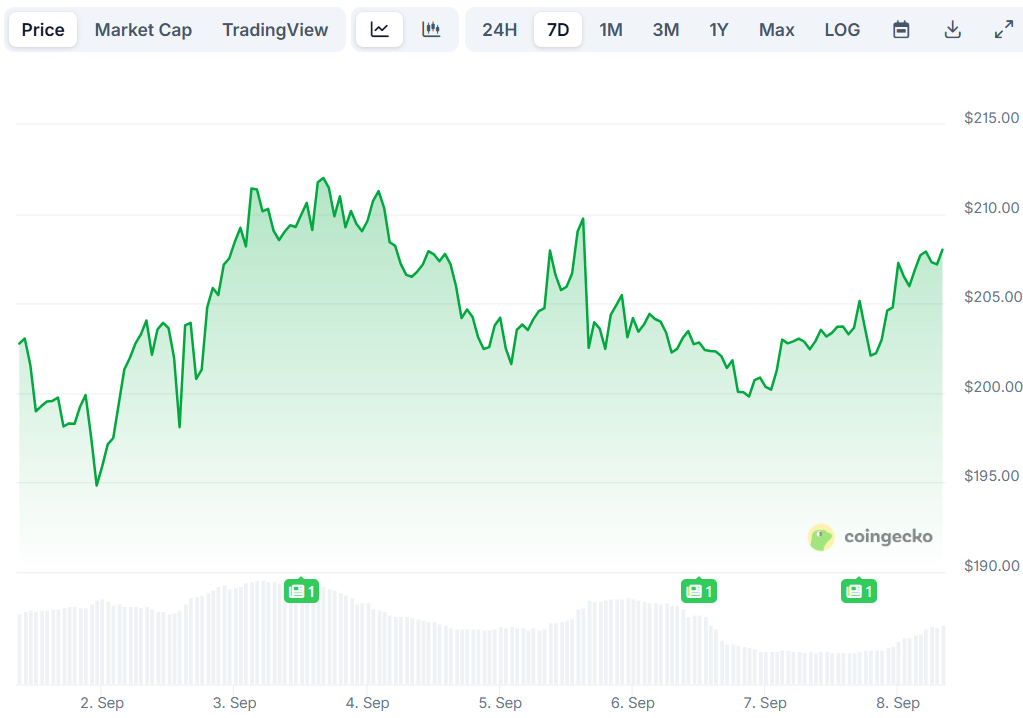
SOL currently trades near $203 after defending key support at $197. This price action occurs as institutional investors join retail whales in building positions ahead of potential breakout scenarios.
Market participants are monitoring Solana price prediction models that suggest the current setup mirrors previous cycles. The 504-day accumulation phase closely matches timeframes that preceded explosive rallies in past market cycles.
Institutional Demand Drives SOL Accumulation
Institutional flow data reveals growing interest in Solana beyond traditional Bitcoin and Ethereum allocations. Folius Ventures allocated over $600,000 into SOL through systematic dollar-cost averaging this week.
This institutional activity aligns with whale accumulation patterns observed by market analysts. Large holder inflows have historically preceded directional moves for Solana price performance.
The combination of retail whale buying and institutional strategies creates a foundation for potential upward momentum. September often marks increased trading activity as market participants return from summer lulls.

Technical Analysis Shows Bullish Structure
Solana price charts display several positive technical indicators supporting the bullish case. The cryptocurrency maintains its position above exponential moving averages on daily timeframes.
RSI indicators hover near neutral territory, providing room for expansion without immediate overbought conditions. This technical setup allows for potential rallies without exhaustion signals appearing.
The symmetrical triangle pattern on shorter timeframes shows compression between $197 support and $213 resistance. A decisive break above $213 could trigger momentum toward the $240-$250 target zone.
Weekly charts confirm the importance of the current resistance test. Multiple attempts to break $213 have created a critical inflection point for near-term price direction.
Solana Price Prediction
Fractal analysis suggests Solana price could be preparing for its next major cycle expansion. The current 504-day consolidation mirrors previous accumulation phases that led to substantial rallies.
If historical patterns repeat, breaking above $213 resistance could unlock targets in the $240-$250 range initially. Longer-term cycle projections extend toward $500 based on fractal comparisons.
Key support remains at $197 for maintaining the current bullish structure. A break below this level could expose deeper support zones at $194 and potentially $189.
The alignment of whale accumulation, institutional interest, and technical patterns creates a compelling setup for September. Solana price prediction models favor upside scenarios if current support levels hold through the resistance test.
Get 3 Free Stock Ebooks
Discover top-performing stocks in AI, Crypto, and Technology with expert analysis.
- Top 10 AI Stocks - Leading AI companies
- Top 10 Crypto Stocks - Blockchain leaders
- Top 10 Tech Stocks - Tech giants

