
 Price Recovers at $80 Support—But Analysts Warn of Deeper Decline Ahead")
Key Takeaways
- SOL recovered 3% over 24 hours following a test of the $80 support zone
- Daily trading volume spiked by almost 90%, hitting $3.7 billion
- Digital asset ETFs recorded $414 million in net outflows, marking the first negative week after five consecutive weeks of inflows
- Critical resistance is positioned between $84 and $85; breaking beneath $78 may push SOL toward $67
- Market observers are monitoring the $70–$80 range as a potential long-term accumulation area
Solana is currently changing hands near $82 following a rebound from the $80 support threshold. The 3% uptick over the last day snapped a four-session decline, though market analysts remain hesitant to declare a full-scale reversal.
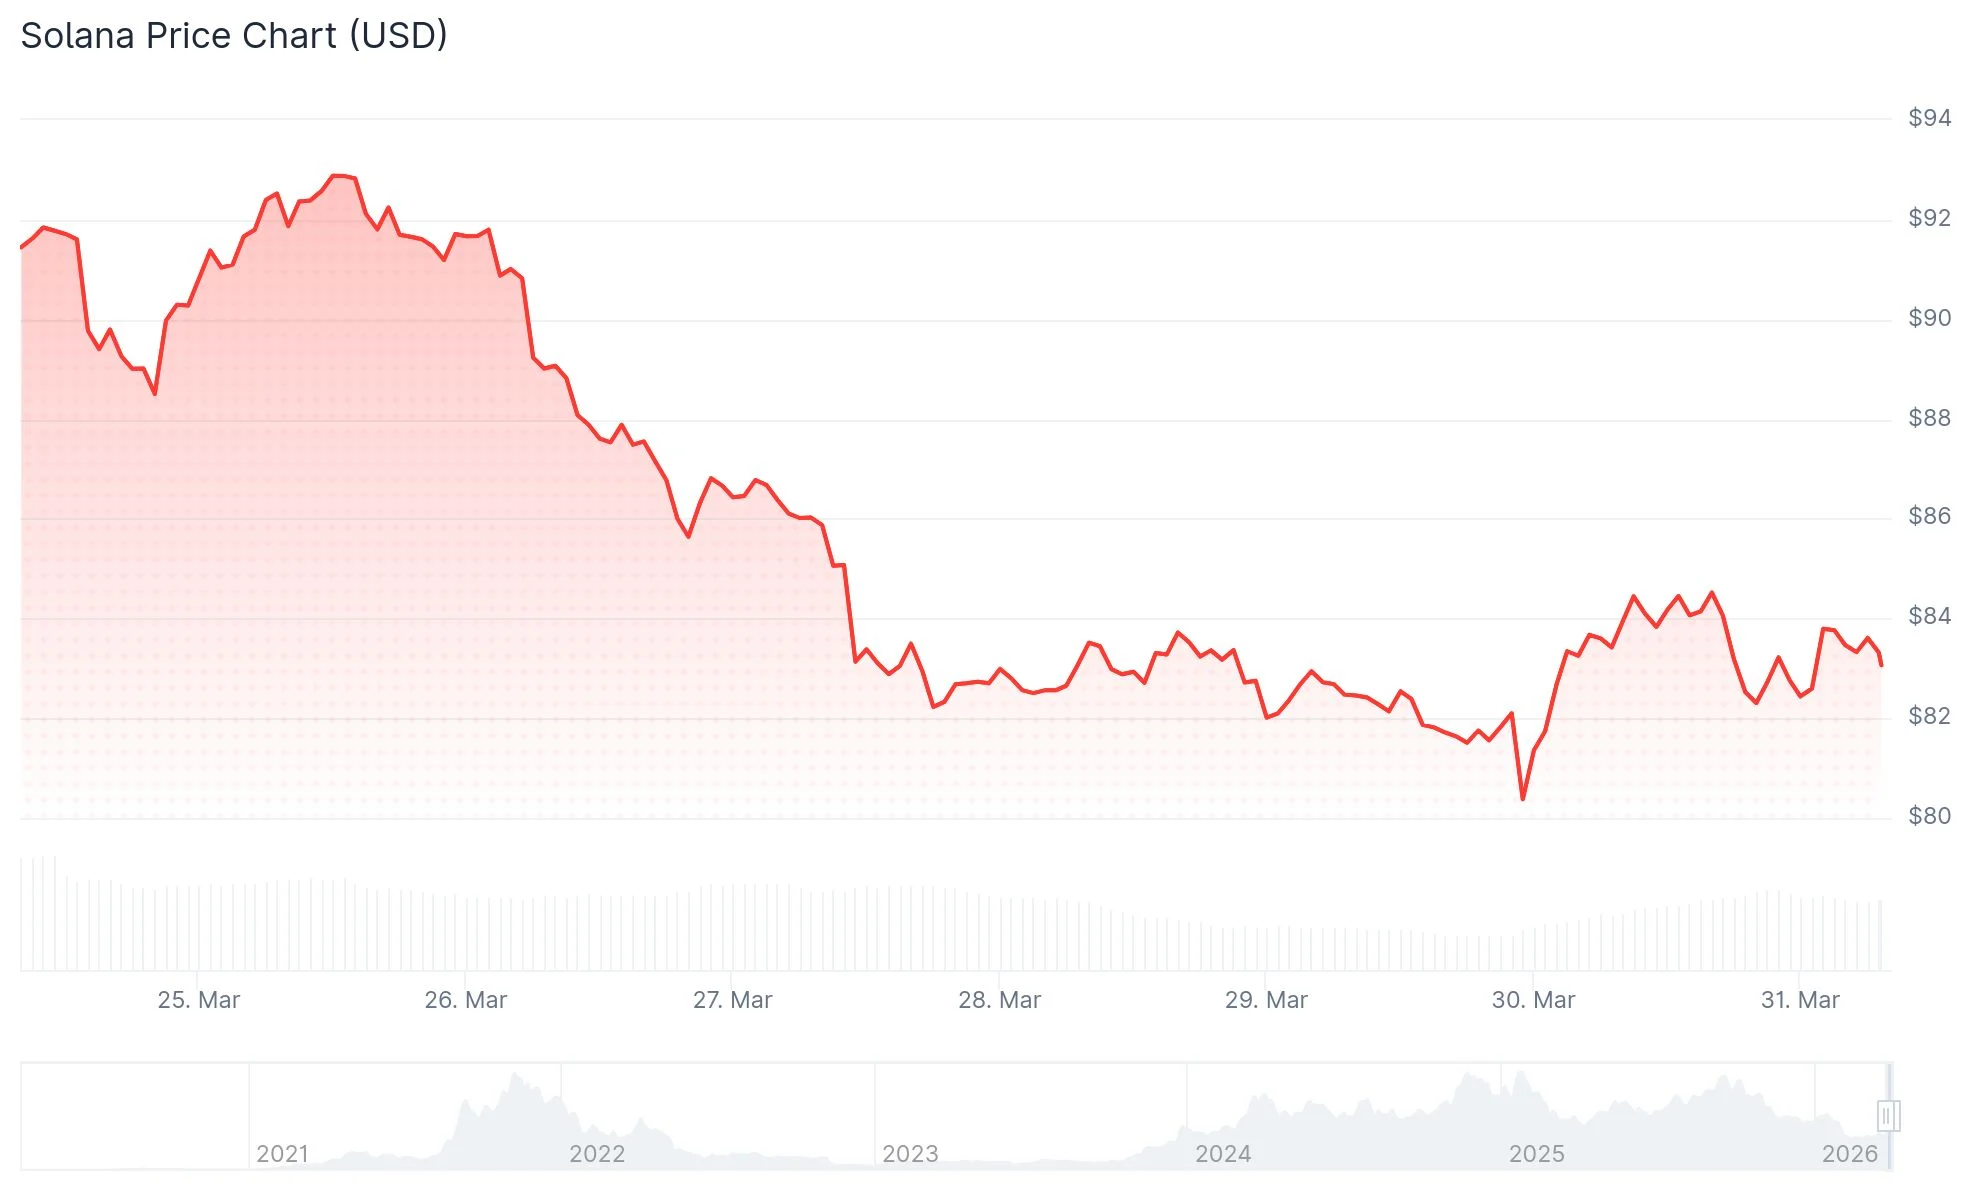
Daily trading activity jumped nearly 90% throughout this timeframe, climbing to $3.7 billion. This figure represents approximately 8% of SOL’s entire circulating supply value.
The rebound at $80 appears to be a technical response to a psychologically significant support threshold. Institutional participants may have positioned buy orders around this mark, though this development doesn’t necessarily validate a momentum shift.
To establish a genuine recovery pattern, SOL must recapture the $90 price point. Such a move would signal an escape from the existing consolidation pattern.
The Relative Strength Index has declined beneath 40 and slipped below its 14-period moving average. This configuration indicates strengthening bearish pressure in the near term.

Critical Price Levels Under Surveillance
The $84–$85 area represents the initial resistance barrier SOL must overcome. This zone previously functioned as support prior to the recent breakdown, making its reclamation a constructive development.
Should buyers maintain control above this territory, market watchers anticipate a possible advance toward $88, followed by $92. Conversely, an inability to defend $82 could initiate another test of the $78 demand area.
A violation below $78 represents the primary downside concern. According to technical analysts, such a breach could drive Solana downward to $67, matching the February 6 low—representing approximately a 20% decline from present values.
Technical analyst Ali Charts indicated on X that downside objectives of $74.11 and $50.18 remain active for SOL should the prevailing bearish structure persist.
Broader Market Headwinds Intensifying Sell Pressure
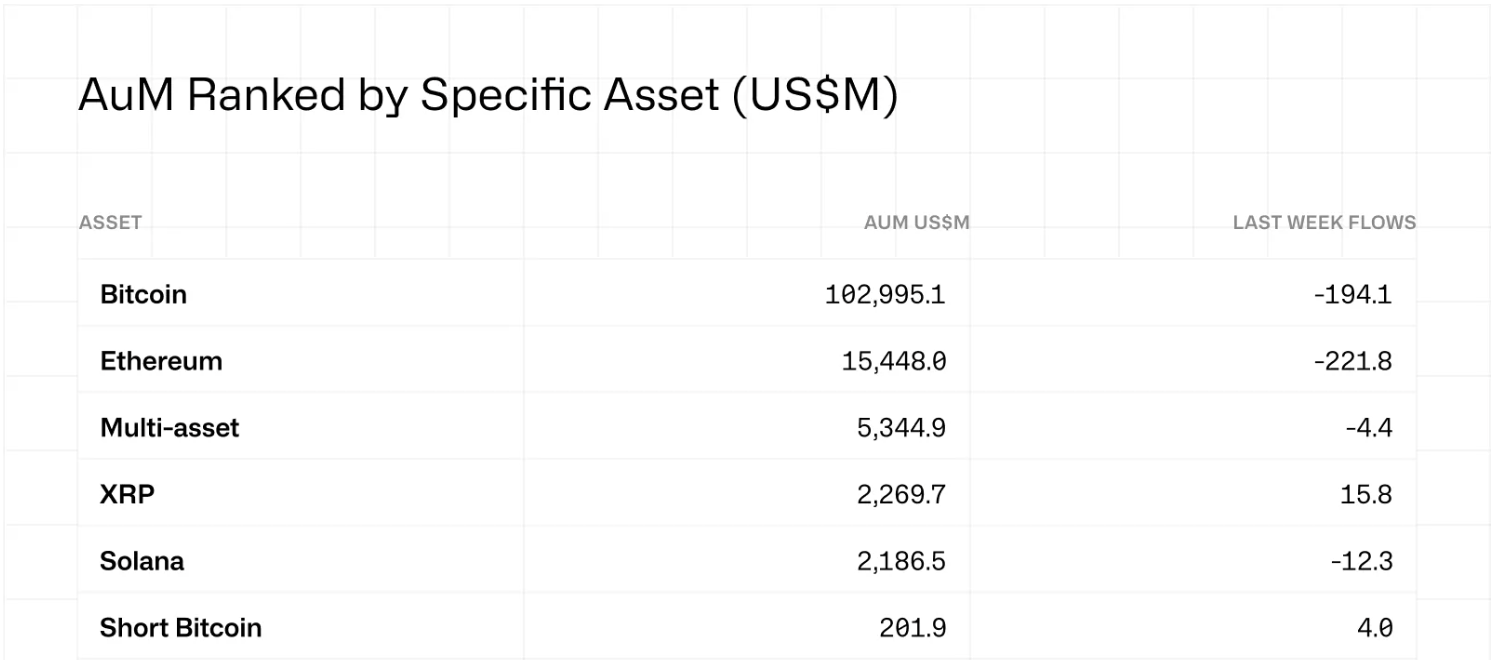
Cryptocurrency ETFs experienced $414 million in net redemptions during the previous week, terminating a four-week period of consistent inflows. CoinShares research analyst James Butterfill attributed this reversal to investor anxiety surrounding the Iran situation and escalating inflation projections.
Crude oil valuations have returned above $100 following a temporary dip under $90. The Strait of Hormuz continues to remain shuttered, sustaining elevated energy costs.
Elevated energy expenses amplify inflation concerns, potentially compelling the Federal Reserve to maintain elevated interest rates for an extended period. Such conditions typically pressure speculative assets including cryptocurrencies.
The Crypto Fear and Greed Index declined from 46 (Neutral territory) to 27 (Fear zone), mirroring the prevailing cautious sentiment across markets.
Market analyst Ted Pillows noted on X that corporate Solana treasury holders continue distributing tokens, with minimal observable buying interest. He projected $50 SOL as achievable during 2026.
At publication time, SOL is priced at $82.30, maintaining weekly losses approaching 10%.
Get 3 Free Stock Ebooks
Discover top-performing stocks in AI, Crypto, and Technology with expert analysis.
- Top 10 AI Stocks - Leading AI companies
- Top 10 Crypto Stocks - Blockchain leaders
- Top 10 Tech Stocks - Tech giants

