
 Price: Recovery Rally Tests $188 After Billion-Dollar IPO Settlement")
TLDR
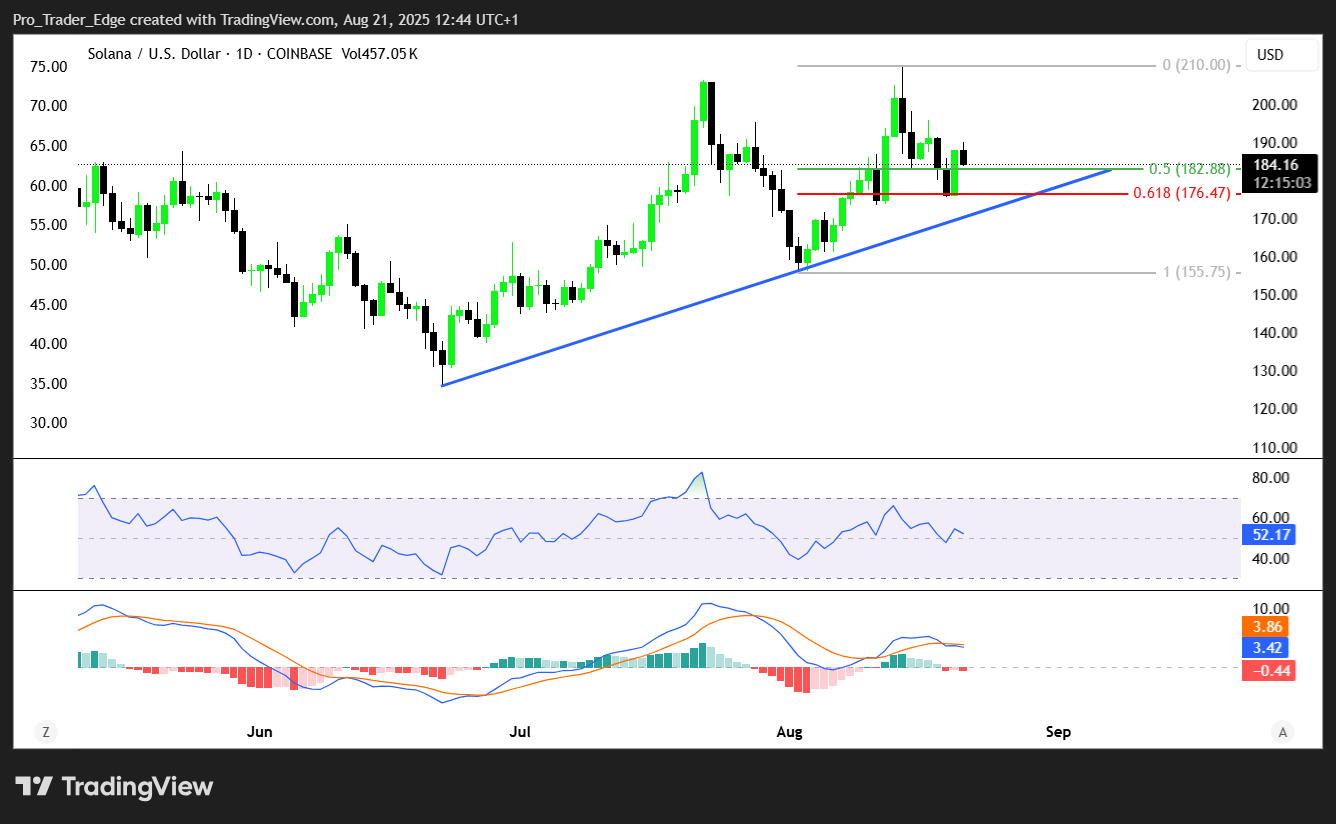
- Solana price recovered from $175 support and broke above $183 bearish trend line
- Network settled Bullish exchange’s entire $1.15 billion IPO using stablecoins
- SOL faces resistance at $188 level with potential targets at $192 and $195
- Daily active addresses increased 500,000 users over three days to 3.6 million
- Network achieved 100,000 TPS throughput milestone but trails Ethereum in monthly returns
Solana price has started a fresh recovery wave after testing the $175 support zone against the US Dollar. The cryptocurrency is now trading above $182 and the 100-hourly simple moving average.

The price broke above a connecting bearish trend line with resistance at $183 on the hourly chart. This technical breakout comes as SOL attempts to establish higher ground following its recent decline.
Solana extended losses after closing below $188, similar to Bitcoin and Ethereum. The token traded below the $185 and $180 support levels before finding a floor at $175.
The current recovery has seen SOL surpass both $180 and $182 resistance levels. The price moved above the 23.6% Fibonacci retracement level of the downward move from the $210 swing high to the $175 low.
On the upside, Solana faces resistance near the $188 level. The next major resistance sits at $192, which represents the 50% Fibonacci retracement level of the recent decline.
Network Processes Major Institutional Transaction
Solana recently processed Bullish exchange’s $1.15 billion IPO entirely via stablecoins. This makes SOL the first Layer 1 blockchain to handle capital-market scale flows natively.

The transaction represents a milestone for institutional adoption. Bullish, a US-based crypto exchange, chose Solana’s network to settle the entire IPO process using stablecoins.
This development puts Solana on the radar for Wall Street-scale financial flows. The network’s ability to handle such large transactions demonstrates its institutional-grade capabilities.
Solana Price Prediction
Solana’s network achieved a verified 100,000 TPS throughput peak recently. This technical milestone showcases the blockchain’s processing capabilities at scale.
Daily active addresses on Solana decreased almost 18% this week compared to Ethereum’s 4.2% decline. This indicates a pullback in network activity despite the technical achievements.
However, SOL’s daily active addresses increased from 3.1 million to 3.6 million over the last three days. This represents an addition of roughly 500,000 active addresses in a short timeframe.
The price performance shows Solana lagging Ethereum on monthly returns. SOL posted just 5% gains versus ETH’s 15% over the same period.
From a technical perspective, the MACD for SOL/USD is gaining pace in the bullish zone. The RSI indicator remains above the 50 level, suggesting continued upward momentum.
If SOL fails to break above $188 resistance, it could decline toward $184 initial support. The first major support level sits at $180, with further downside targeting $175.
A successful break above $195 resistance could set the pace for another steady increase toward $200 and eventually $210.
Get 3 Free Stock Ebooks
Discover top-performing stocks in AI, Crypto, and Technology with expert analysis.
- Top 10 AI Stocks - Leading AI companies
- Top 10 Crypto Stocks - Blockchain leaders
- Top 10 Tech Stocks - Tech giants

