
 Price: Testing Key Support at $184 as Volume Surges")
TLDR
- Solana trades at $184 with a 10.15% weekly decline but trading volume jumped 42% to $8 billion
- The cryptocurrency is testing critical support at $180, which could determine its next direction
- Analysts say a bounce from current levels could push SOL to $187-$198, or $210-$220 if it breaks $195
- Solana has failed multiple times to break above the 200 EMA, with next support at $145 if current level fails
- Open interest increased to $8.88 billion while liquidations totaled $24.26 million in 24 hours
Solana is trading at $184 after dropping 0.03% in the past 24 hours. The cryptocurrency has declined 10.15% over the last seven days.
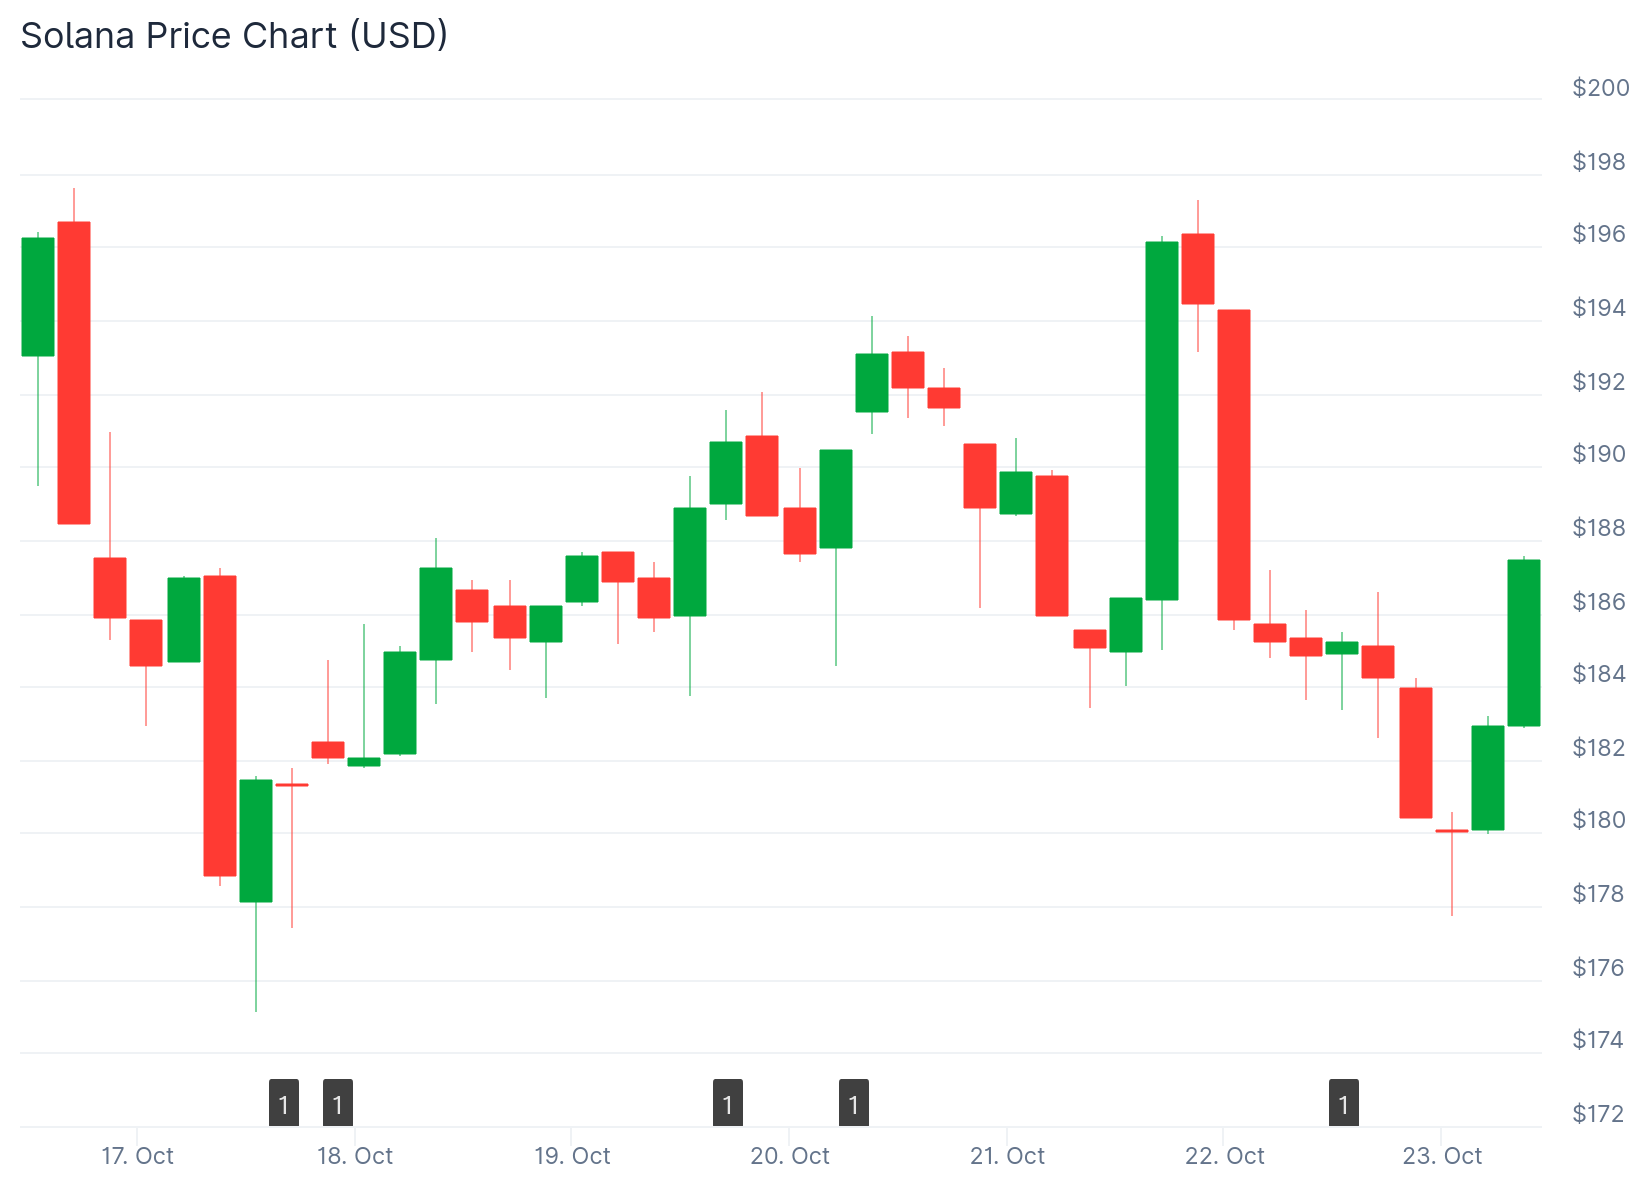
Trading volume tells a different story. Volume increased by 41.9% to reach $8 billion, showing strong market interest despite the price decline.
The volume spike during a price drop indicates active trader participation. Market participants continue to engage with Solana even as it moves lower.
CoinGlass data reveals trading volume rose 39.17% to $25.07 billion. Open interest climbed 0.24% to $8.88 billion, confirming ongoing market activity.
The SOL OI-Weighted Funding rate sits at -0.0037%. This metric shows traders remain active in the Solana market.
Critical Support Zone Under Pressure
Crypto analyst BullishBanter points out that Solana has reached a pivotal support level. The price is holding at its lower trendline, creating a key defense zone for buyers.

This support level will determine Solana’s near-term price movement. A break below could trigger further losses.
Analysts predict that a bounce from $180 support could send Solana to the $187-$198 range. This would mark a recovery from current price levels.
BitGuru notes that Solana is maintaining position above $180 support despite its downtrend. Buyers appear to be entering the market at this level.
A move above $195 could open the path to $210-$220. This breakout would signal a short-term trend reversal for the cryptocurrency.
Technical Resistance Blocks Upside Movement
The 200 Exponential Moving Average continues to cap Solana’s upward attempts. This technical indicator has become a strong resistance barrier.
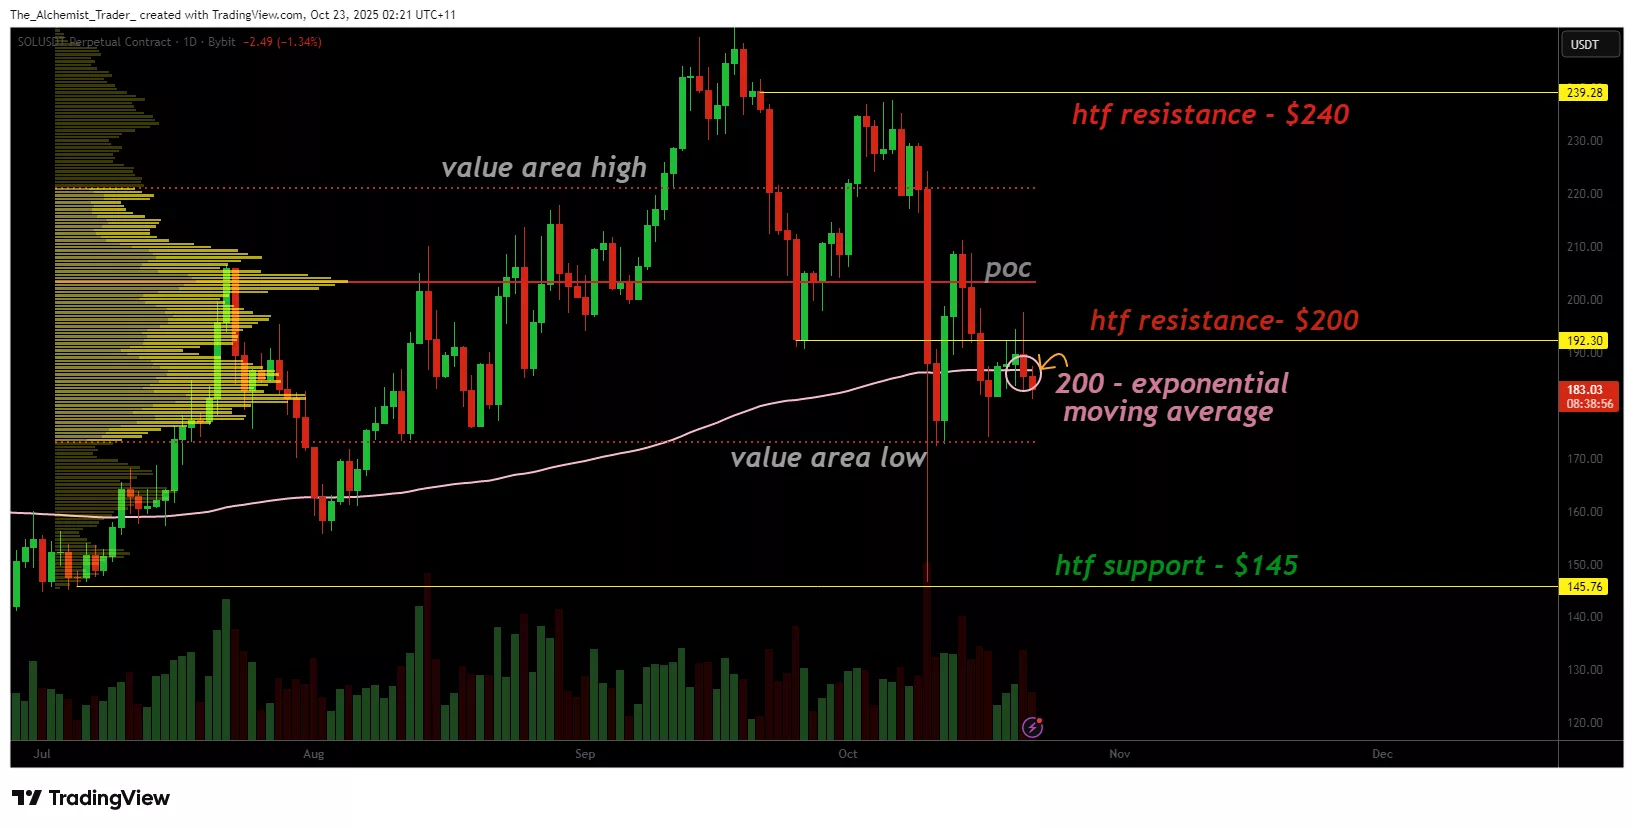
Solana has tried several times to break above the 200 EMA without success. Each failure has resulted in renewed selling pressure.
The 200 EMA lines up with psychological resistance near $200. This double resistance makes it harder for bulls to push through.
While Solana trades below the 200 EMA, the risk of testing lower supports remains high. The next major support level sits at $145.
The $145 zone represents a previous swing low and important demand area. This level would come into play if the $180 support breaks.
Liquidations Reflect Active Trading
Liquidations reached $24.26 million over the last 24 hours. Long positions accounted for $15.14 million, while shorts made up $9.12 million.
These liquidation figures show traders actively adjusting their positions. The market remains volatile as participants respond to price movements.
Solana’s market structure shows a series of lower highs since the rejection near $200. This pattern confirms the bearish trend remains intact.
For the trend to reverse, Solana needs a daily close above the 200 EMA with strong volume. Without this confirmation, any rallies will likely be short-lived corrections.
Traders are monitoring the $180 support closely. Whether this level holds or breaks will determine if Solana recovers toward $198 or drops to test $145 support.
Get 3 Free Stock Ebooks
Discover top-performing stocks in AI, Crypto, and Technology with expert analysis.
- Top 10 AI Stocks - Leading AI companies
- Top 10 Crypto Stocks - Blockchain leaders
- Top 10 Tech Stocks - Tech giants

