
 Price Tests Critical $88 Resistance Following 6% Surge")
Key Highlights
- SOL broke through the $82 and $85 thresholds following a bullish flag formation on the 60-minute timeframe.
- The token touched $87.04 before experiencing a minor pullback and stabilizing around mid-$80s levels.
- Bulls face a critical challenge at the $87.20-$88 resistance zone.
- Downside protection exists at $83.75, followed by $82.70, with major support at $80.
- Technical indicators present a mixed picture, showing near-term strength while longer timeframes suggest caution.
On April 8, Solana (SOL) demonstrated significant upward momentum as buyers propelled the cryptocurrency beyond both the $82 and $85 price points. This breakout has positioned SOL within a constructive short-term trajectory.
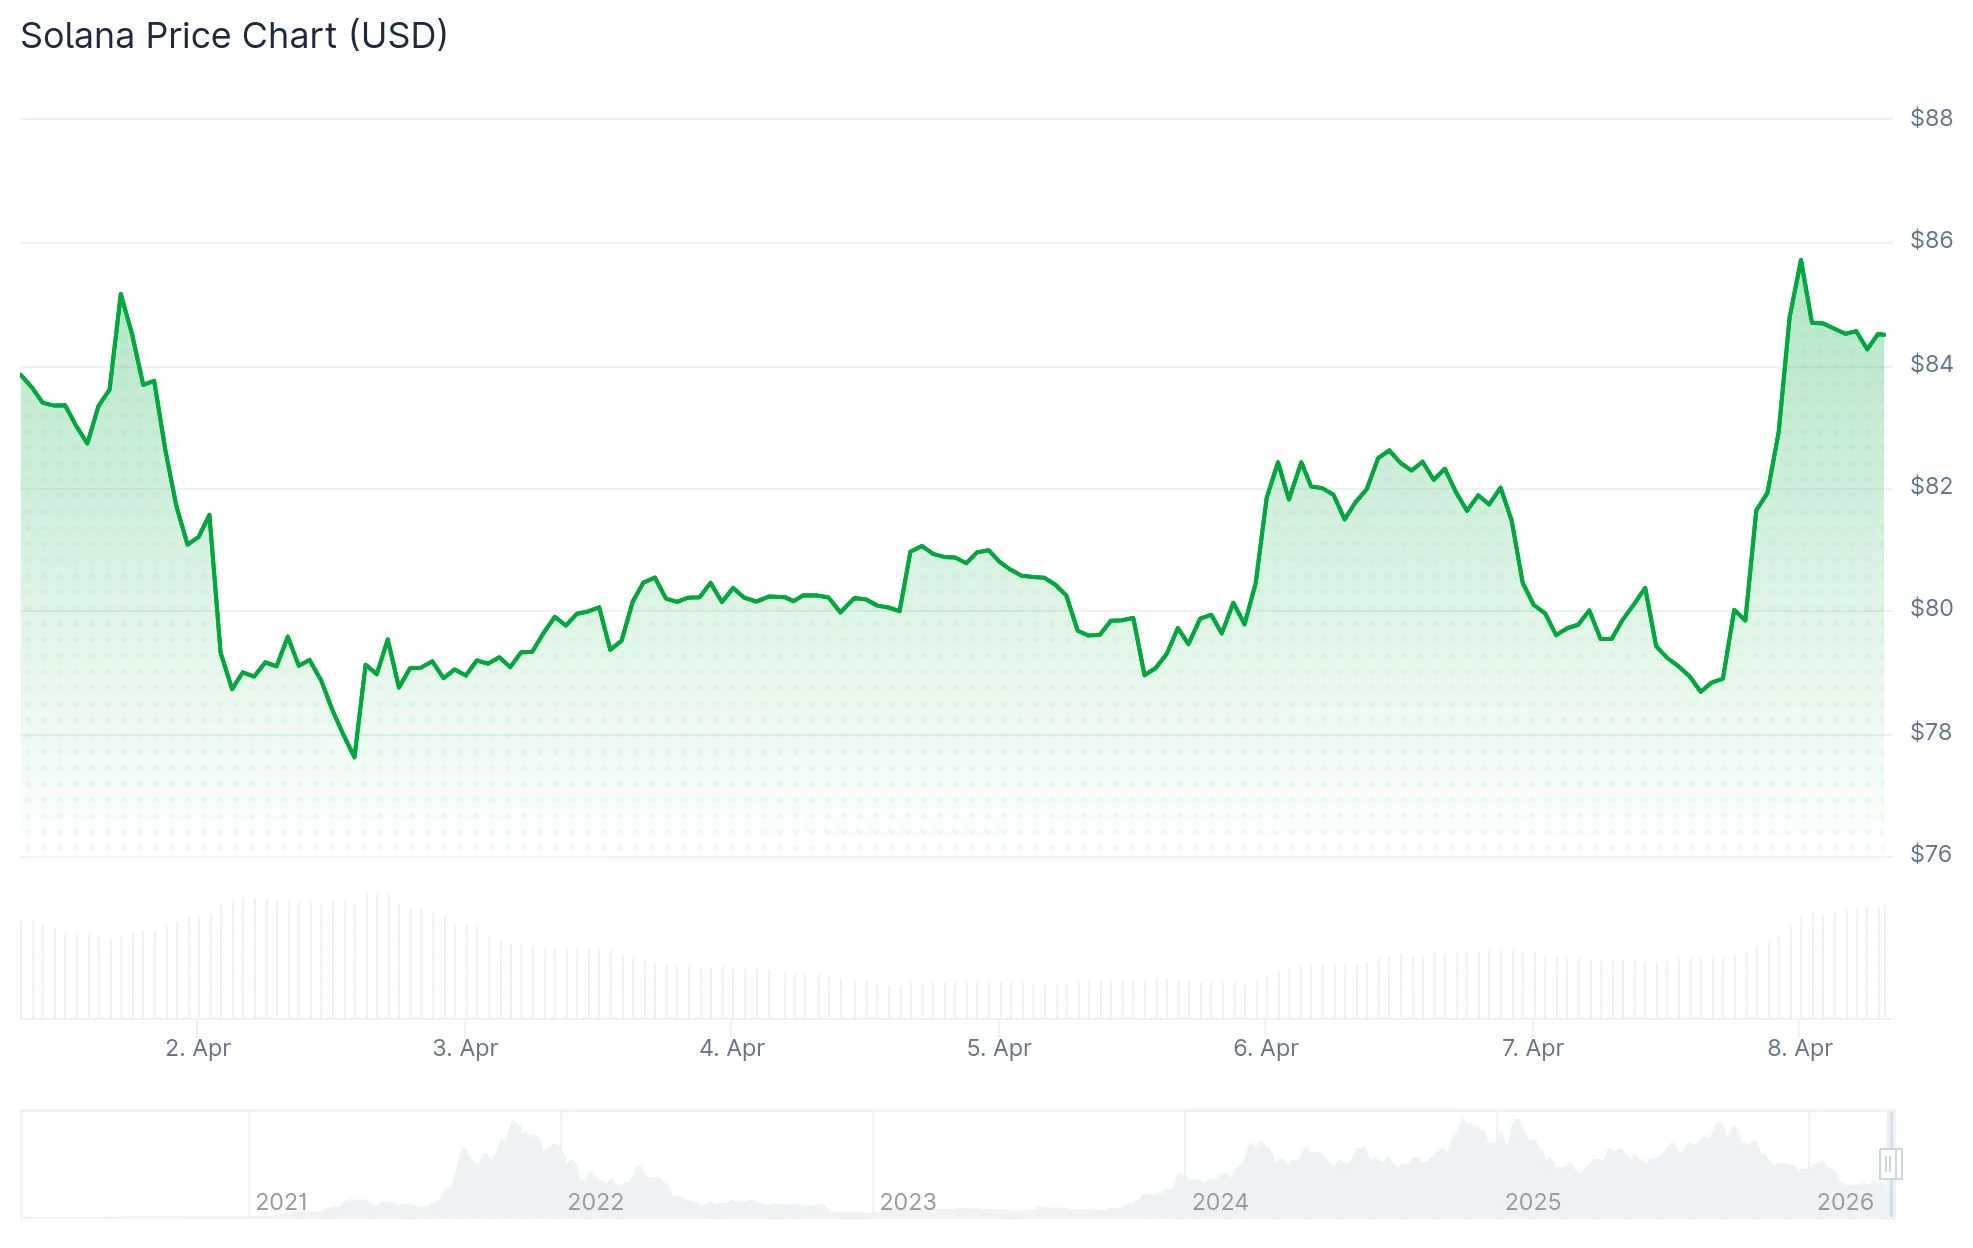
After peaking at $87.04, the digital asset experienced modest profit-taking. Current trading activity shows SOL hovering between $84 and $85, successfully maintaining the majority of its intraday advance.
Technical chart analysis on the hourly interval reveals SOL successfully cleared a bullish flag consolidation pattern that had capped price action at $80. This technical breakout served as the catalyst for the current upward trajectory.
Current positioning shows SOL trading comfortably above its 100-hour simple moving average, a development that keeps trader focus directed toward subsequent resistance barriers.
The immediate obstacle appears around the $85 mark. Beyond that, the primary resistance cluster resides near $88.

Should bullish momentum carry SOL above the $88 threshold, subsequent targets emerge at $95 and $102. Extended strength could eventually challenge the $112 level.
Recent advance encounters technical barriers
Market data indicated SOL posted a 5.85% daily gain, bringing the token to approximately $84.18. This positioning places the cryptocurrency marginally beneath both its 20-day and 50-day moving averages.
The 200-day moving average sits substantially higher at $134.10. Meanwhile, the Ichimoku Kijun indicator near $87.19 represents the most pressing overhead resistance level.
This technical setup reinforces the significance of the $87.20-$88 zone. Currently, SOL remains engaged in the process of navigating through this price region.
Momentum oscillators presented conflicting signals. While the RSI maintained a mildly constructive stance, both the Stoch RSI and BBP suggested overbought territory following the sharp advance.
Analysis suggests the probable near-term trading corridor extends from $83.50 to $86.50, barring a decisive breakout. This assessment aligns with the current consolidation phase following the rally.
Critical support zones identified
Should Solana prove unable to penetrate the $88 barrier, downward pressure could reemerge. The first support layer appears near $83.75.
A more substantial support floor exists at $82.70, coinciding with the 50% Fibonacci retracement level calculated from the recent swing low of $78.38 to the $87.04 high. Beyond that, market participants are closely monitoring the $80 threshold.
A confirmed close beneath $80 would likely expose the $75 area, signaling a reversal of the recent recovery attempt.
Ali Charts highlighted that Solana continues trading within a broader consolidation channel, bounded by resistance at $96.04 and support at $76.66. According to his assessment, the coming 48 hours could prove decisive for April’s price direction. A successful defense of support could trigger a rebound toward $81 and $85, whereas a breakdown below $76.66 might accelerate selling toward $68.54.
Additional context includes recent security initiatives launched by the Solana Foundation and evolving regulatory developments in the United States. Nevertheless, the current technical picture remains focused on price action: SOL achieved a peak of $87.04 and now faces a crucial test at the $87.20-$88 resistance band to determine continuation potential.
Get 3 Free Stock Ebooks
Discover top-performing stocks in AI, Crypto, and Technology with expert analysis.
- Top 10 AI Stocks - Leading AI companies
- Top 10 Crypto Stocks - Blockchain leaders
- Top 10 Tech Stocks - Tech giants

