
 Price: Token Holds $210 as Double Buy Signal Appears")
TLDR
- Solana dropped from $250 to test key $210 support after breaking below $220 resistance
- TD Sequential double buy signal appears on 4-hour chart at current support zone
- Bearish trend line caps recovery attempts with resistance positioned at $222
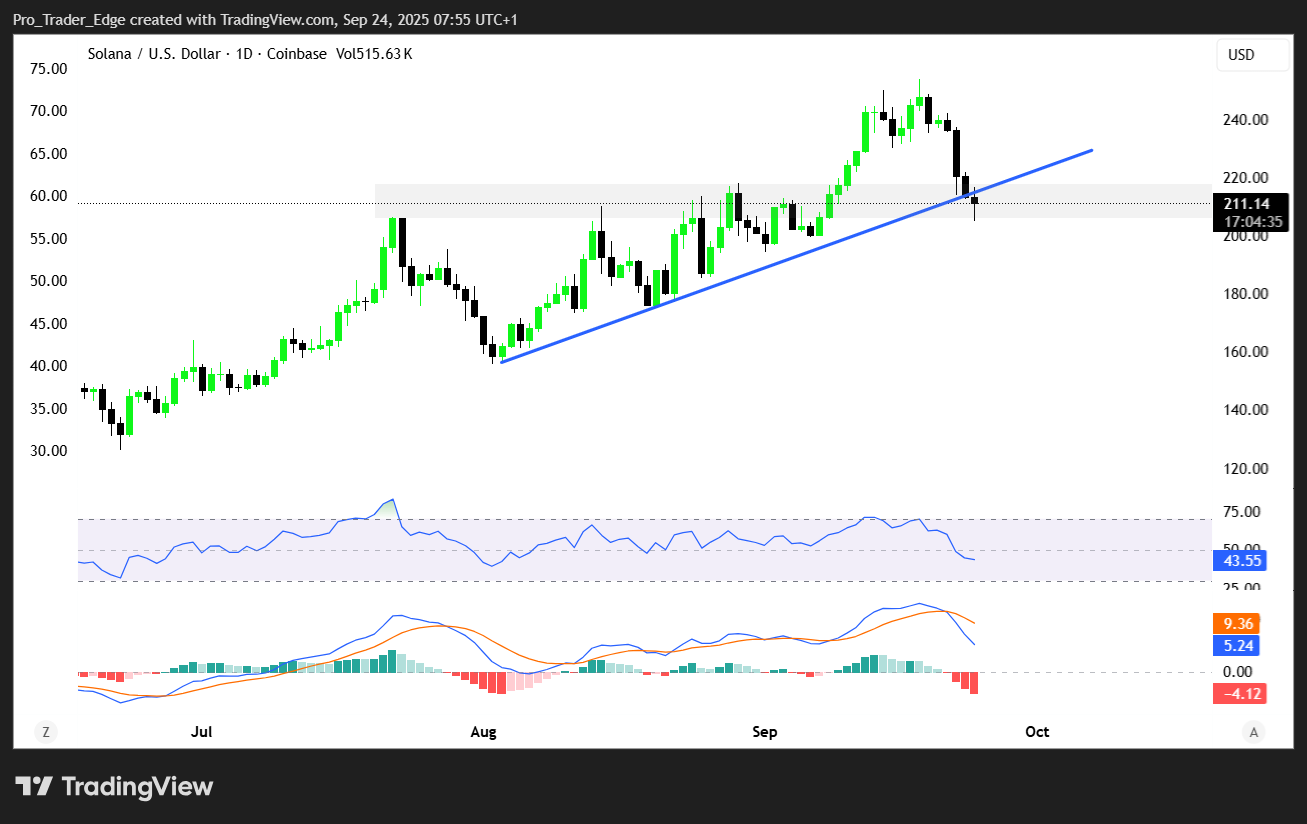
- Rising channel pattern intact since August supports potential rally to $250-$280
- Failure to hold $210 could trigger decline toward $200 psychological support
Solana price has declined sharply from recent highs near $250, bringing SOL to a pivotal moment at the $210 support level. Technical indicators suggest a potential reversal could be forming at this critical juncture.
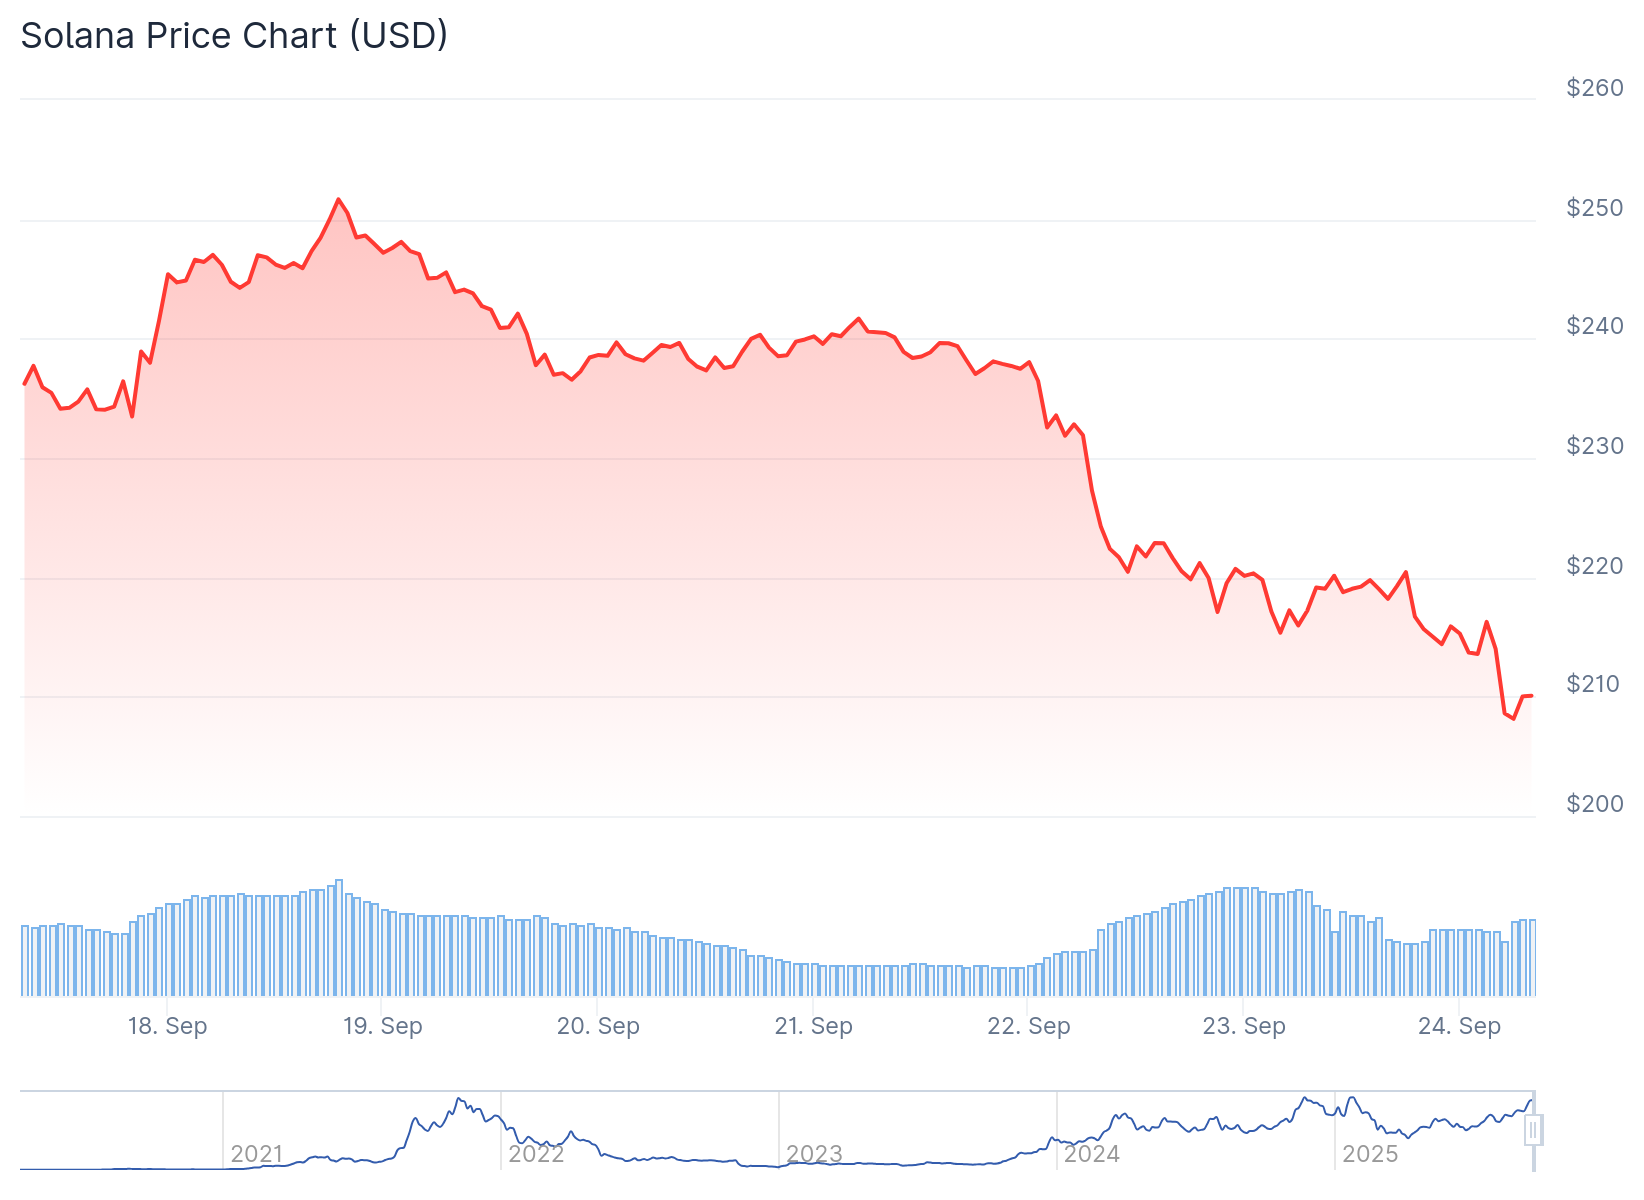
The selloff began when Solana failed to sustain momentum above $250. Bears drove the price below key support levels at $240 and $230, eventually pushing SOL under the important $220 threshold.
SOL continued falling as it broke below the 100-hourly simple moving average. The decline reached a temporary low at $207 before consolidating around current levels.
Technical analysis shows a bearish trend line has formed with resistance at $222. This level presents a major obstacle for any near-term recovery attempts.
Technical Indicators Signal Potential Reversal
Despite recent weakness, bullish signals are emerging on Solana’s price charts. The TD Sequential indicator has generated a double buy signal on the 4-hour timeframe as SOL approaches $210 support.
This support level carries additional weight due to confluence with the 0.618 Fibonacci retracement. The combination creates strong technical foundation that could halt further declines.

The rising channel pattern containing SOL’s price action since early August remains unbroken. Within this structure, TD Sequential has printed “9” and “13” counts in oversold territory.
These readings typically signal trend exhaustion and potential reversal conditions. The timing of these signals at current support makes the price action particularly relevant for traders.
If buyers successfully defend $210, immediate upside targets include $215 and $222 resistance levels. A break above $222 could trigger larger recovery toward $230.
Key Levels Define SOL’s Next Direction
The $230 level represents 50% Fibonacci retracement of the decline from $254 to $207. Breaking above this area could establish foundation for testing $242 resistance.
Additional gains might push Solana back toward $250 where the recent decline originated. Breaking $250 could extend rallies to $263 and potentially $280-$290 Fibonacci extension zones.
However, failure at $210 support would compromise the bullish outlook. Breakdown below this level could expose $202 support to selling pressure.
The $200 level represents major psychological support that historically attracts buyers. Closing below $200 could trigger additional selling toward $184 support.
Current technical indicators show mixed readings regarding immediate direction. Hourly MACD gains pace in bearish territory while RSI remains below 50.
Market participants closely monitor SOL’s response to the current support test. The cryptocurrency maintains its position among the most active Layer-1 ecosystems with growing institutional adoption.
Solana’s network continues hosting major DeFi, NFT, and payment applications. Institutional interest keeps growing with SOL appearing more frequently in crypto investment products.
The broader altcoin recovery trend positions Solana as potential leader in sustained rallies. Network fundamentals support the technical setup emerging on price charts.
SOL currently consolidates near $210 support with TD Sequential double buy signal suggesting reversal potential if this level holds.
Get 3 Free Stock Ebooks
Discover top-performing stocks in AI, Crypto, and Technology with expert analysis.
- Top 10 AI Stocks - Leading AI companies
- Top 10 Crypto Stocks - Blockchain leaders
- Top 10 Tech Stocks - Tech giants

