
 Rebounds From $80 Support – But Bears May Not Be Done Yet")
Key Takeaways
- Solana recovered 3% over 24 hours following a test of the $80 support zone
- Daily trading activity jumped nearly 90%, hitting $3.7 billion in volume
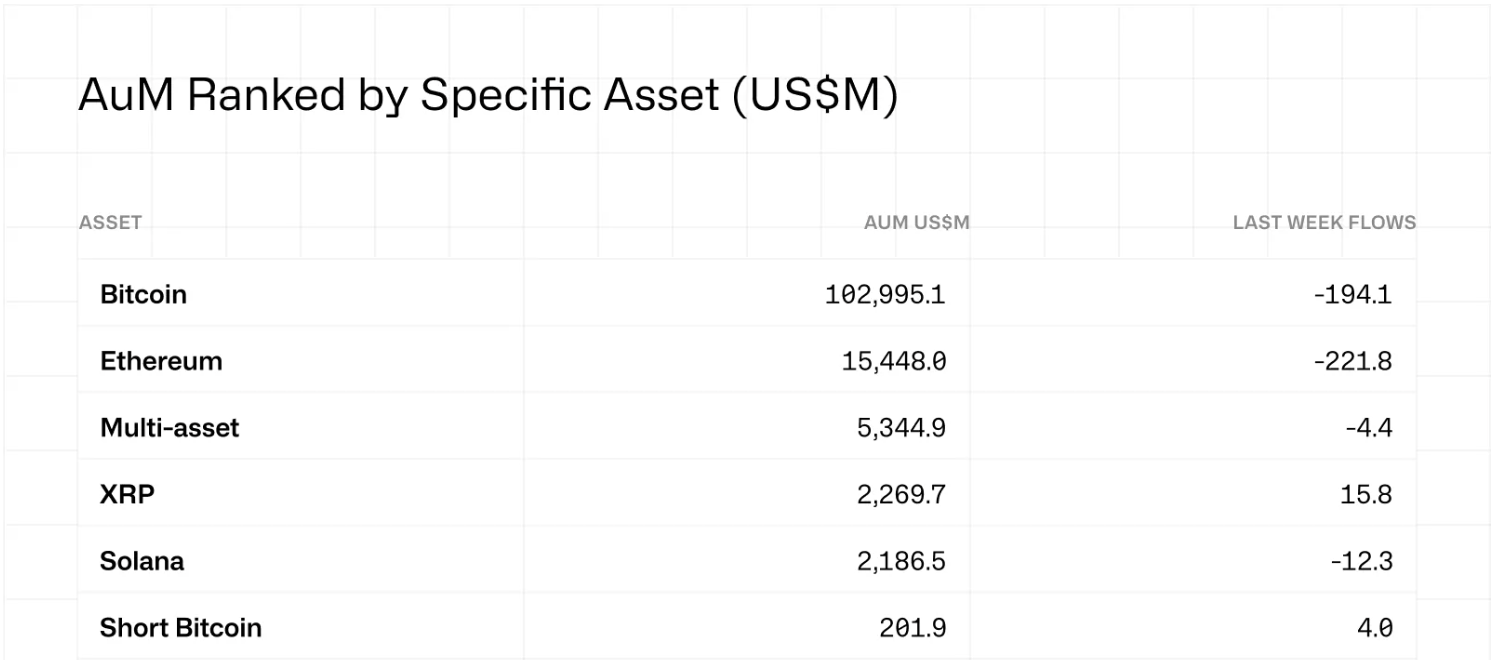
- Digital asset ETFs experienced $414 million in net outflows during their first negative week in over a month
- Critical overhead resistance lies between $84 and $85; breaking beneath $78 may trigger a decline to $67
- Market observers identify the $70–$80 range as a potential long-term accumulation area
Solana is currently changing hands near $82 following a rebound from the $80 threshold. While the modest 3% uptick over the last day snapped a four-session decline, market analysts remain cautious about declaring a sustained reversal.
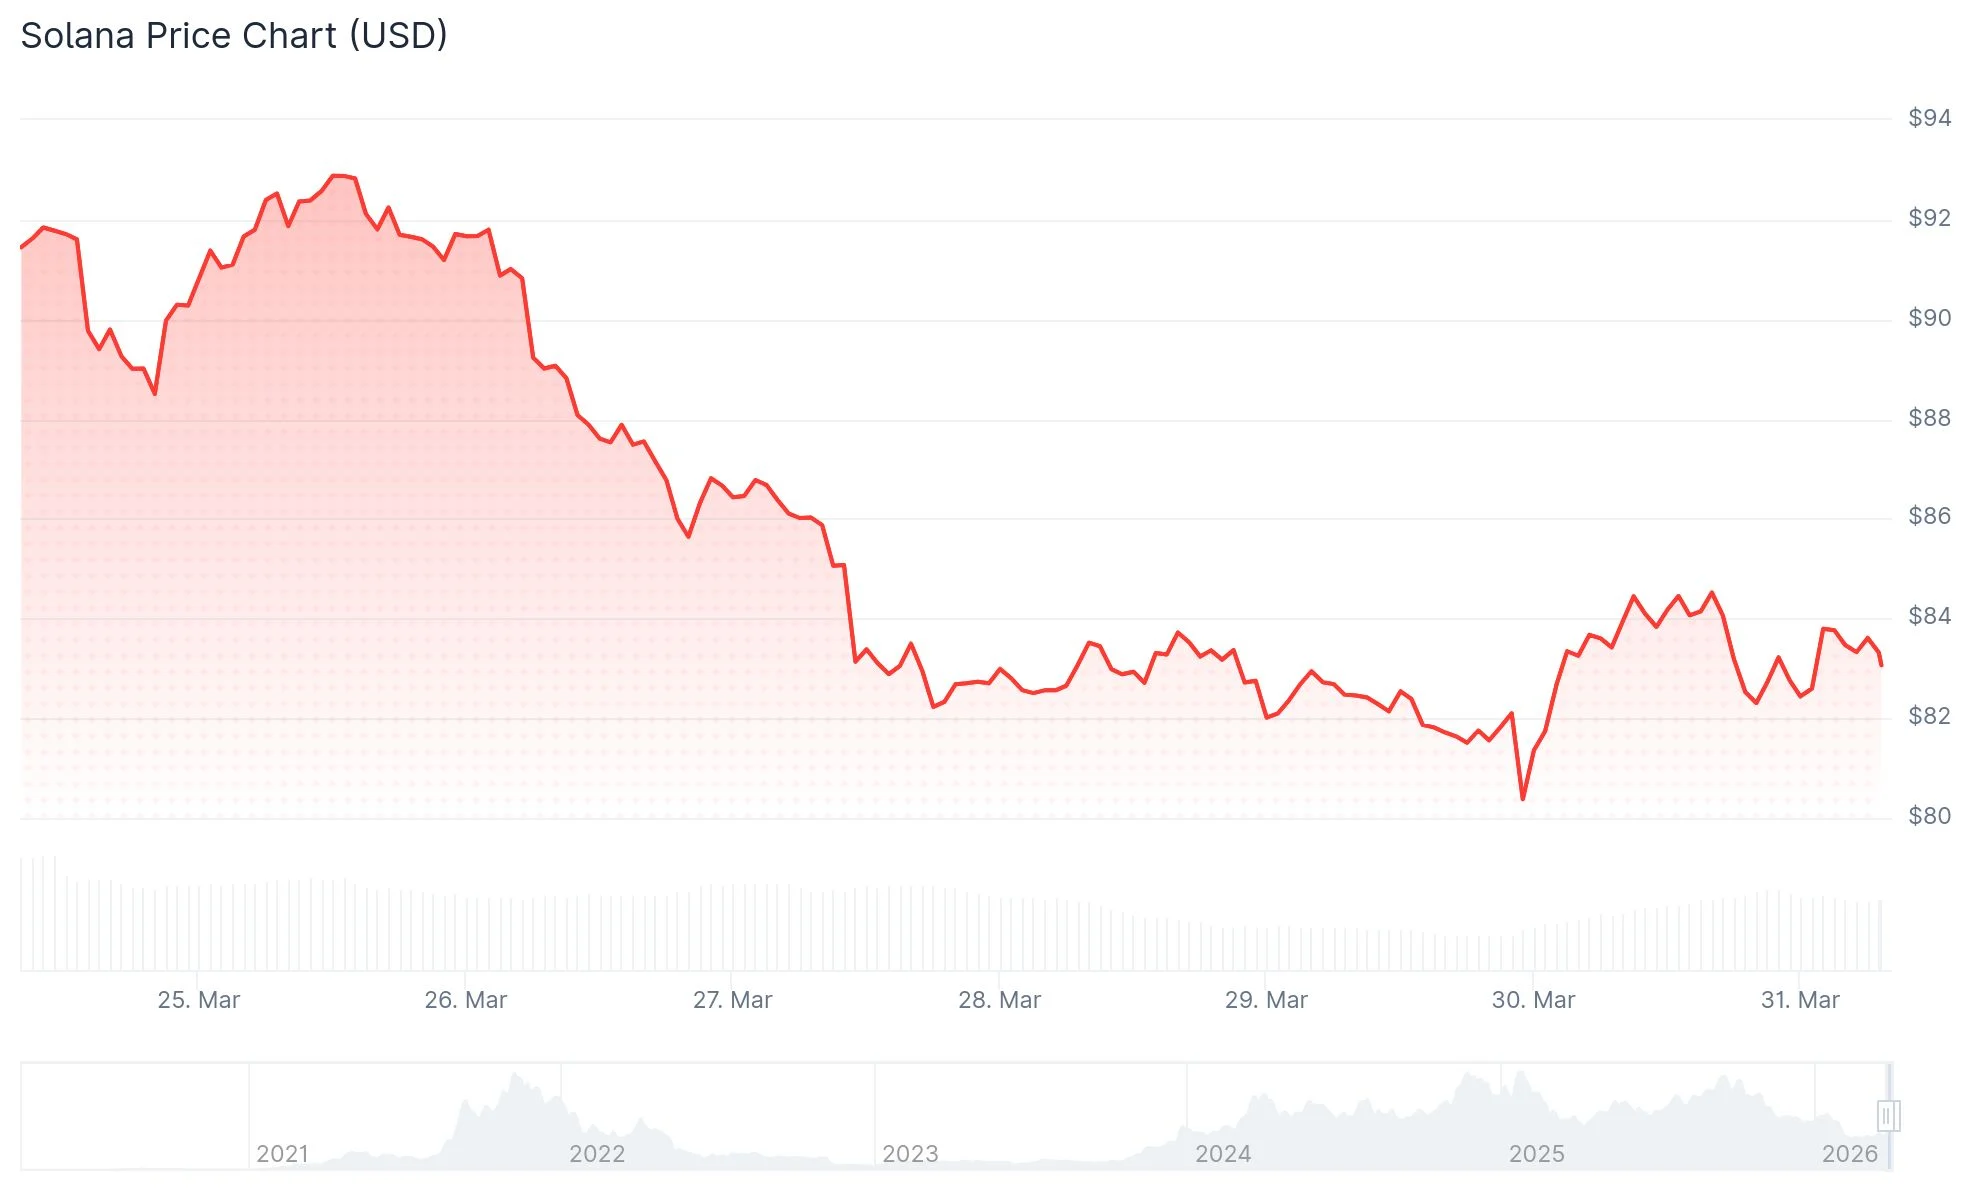
Daily trading volumes climbed by approximately 90% throughout this timeframe, touching $3.7 billion. This figure represents roughly 8% of SOL’s entire circulating supply valuation.
The $80 level bounce appears to be a technical response to psychological support at a whole number. Institutional purchase orders may have been stacked around this price point, though such action doesn’t necessarily signal a momentum shift.
To validate a genuine recovery pattern, Solana would need to push back above the $90 threshold. Such a move would indicate an escape from the present consolidation pattern.
The Relative Strength Index has declined beneath the 40 mark and crossed below its 14-period moving average. This configuration suggests intensifying downside pressure over the near term.

Critical Price Zones Under Surveillance
The immediate hurdle for SOL sits in the $84–$85 corridor. This region functioned as a support floor before the recent breakdown, making a successful reclaim technically significant.
Should buyers defend territory above this band, technical strategists identify possible advancement toward $88 followed by $92. Conversely, inability to maintain $82 could prompt another visit to the $78 demand area.
The breakdown scenario below $78 presents the most significant downside threat. Market technicians warn that such a development might push Solana toward $67, matching the February 6 bottom — representing approximately a 20% decline from present valuations.
Technical analyst Ali Charts highlighted on X that downside objectives of $74.11 and $50.18 remain relevant for SOL should the current negative structure persist.
Broader Market Dynamics Intensifying Pressure
Digital asset exchange-traded funds registered $414 million in net redemptions during the previous week, halting a four-week run of positive capital flows. CoinShares research head James Butterfill attributed this reversal to heightened investor anxiety surrounding Middle East tensions and inflation trajectory concerns.
Crude oil valuations have climbed back beyond the $100 mark after a temporary dip under $90. Ongoing closures at the Strait of Hormuz continue supporting elevated energy prices.
Escalating energy expenses amplify inflation anxieties, potentially compelling the Federal Reserve to maintain restrictive monetary policy for an extended period. Such conditions typically create headwinds for speculative assets including cryptocurrencies.
The Crypto Fear and Greed Index tumbled from 46 (Neutral territory) to 27 (Fear zone), capturing the prevailing market apprehension.
Market commentator Ted Pillows noted on X that corporate entities holding Solana treasury positions continue liquidating holdings, with minimal observable accumulation activity. He projected that $50 SOL remains achievable by 2026.
At publication time, SOL trades at $82.30 with weekly losses hovering around 10%.
Get 3 Free Stock Ebooks
Discover top-performing stocks in AI, Crypto, and Technology with expert analysis.
- Top 10 AI Stocks - Leading AI companies
- Top 10 Crypto Stocks - Blockchain leaders
- Top 10 Tech Stocks - Tech giants

