
 Slips Under $80 Amid Rising Geopolitical Risk and Market Volatility")
Key Highlights
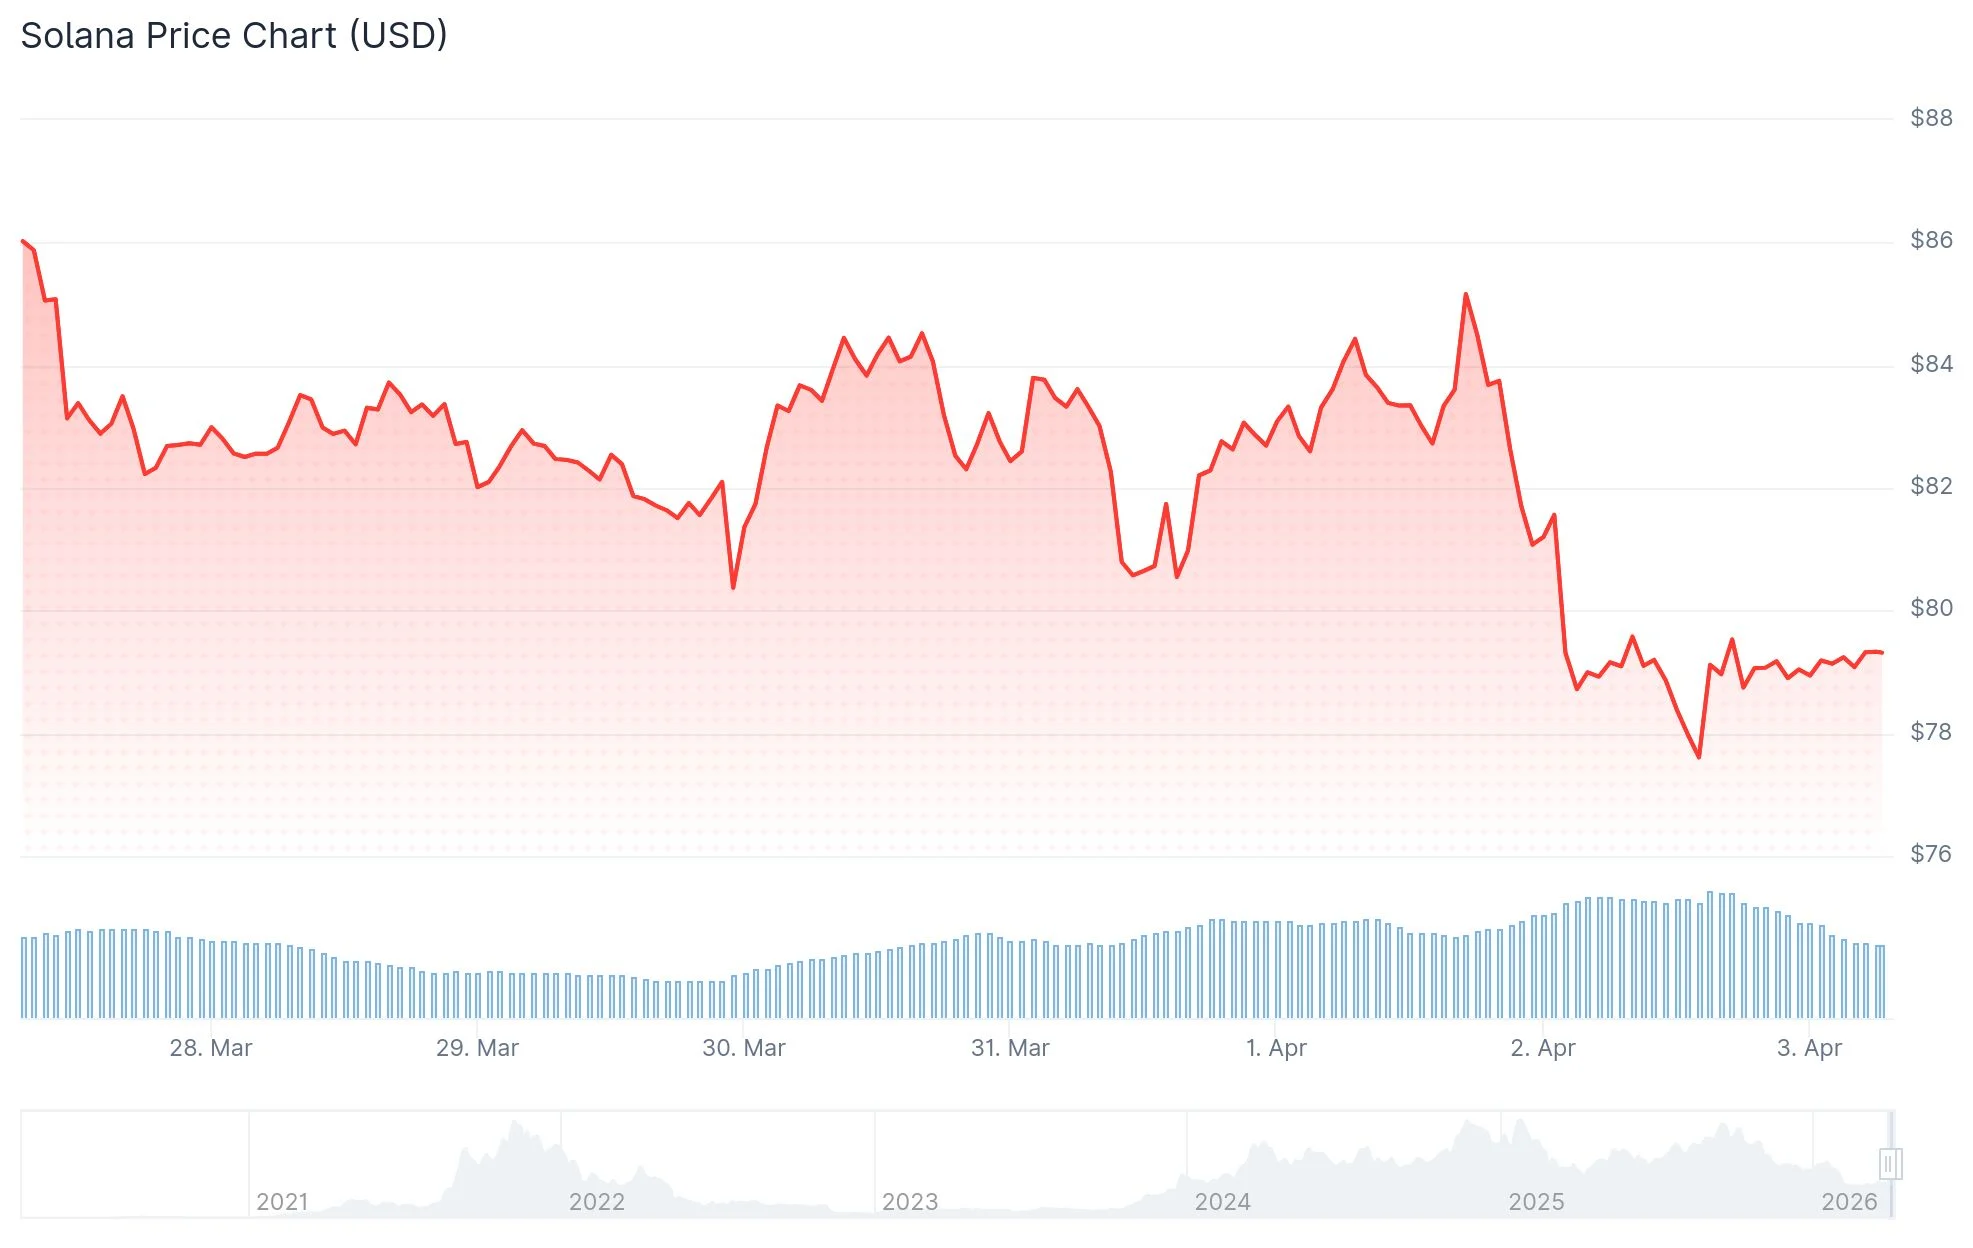
- SOL declined 5.4% and broke beneath the $80 level as geopolitical concerns related to Iran escalated following presidential statements
- Critical resistance zone established between $82.22 and $85.94; failure to hold $78 may lead to a decline toward $67
- More than $20 million in long position liquidations occurred within a 24-hour window, indicating intensified bearish pressure
- Daily chart RSI declined beneath the 40 threshold, reinforcing bearish technical momentum
- Technical experts identify $50 to $60 as the next significant support area if present levels give way
Solana (SOL) experienced a notable downturn in the last day, declining 5.4% and sliding beneath the $80 mark as market sentiment deteriorated. The downturn was primarily fueled by international political developments, particularly President Donald Trump’s statement threatening to strike Iran with substantial force in the near term.
Oil prices surged close to $110 in response to these remarks. This increase heightened worries about inflationary pressures and prompted market observers to adjust their forecasts regarding potential Federal Reserve interest rate reductions in 2026. When expectations for monetary easing diminish, speculative assets such as cryptocurrencies typically experience downward pressure.
[[TWITTER_EMBED]]Immediate overhead resistance is located within the $82.22 to $85.94 range. This area encompasses multiple Fibonacci retracement levels including the 23.6%, 38.2%, and 50.0% markers. Any attempt to rally into this territory may encounter renewed selling pressure unless substantial buying interest emerges.
Trading Activity and Liquidation Data Reveal Bearish Sentiment
Trading volume for Solana surged by 30% over the past day, climbing to approximately $6 billion—roughly 13% of the token’s circulating market capitalization. This exceptional increase in activity suggests significant selling pressure in the market.
Long position liquidations surpassed $20 million during this timeframe. Should this figure exceed $25 million, it would represent one of the most challenging sessions for bullish traders since early February, when SOL tumbled from $100 down to $78.

The Relative Strength Index on the daily timeframe has dropped below 40, a level that traditionally signals strengthening bearish momentum. Additionally, three consecutive sell signals have materialized on the 4-hour chart, indicating that institutional participants may be actively reducing positions.
A breakdown below the $78 support threshold could pave the way for a move toward $67, which would represent approximately a 13% decline from current price levels.
Long-Term Technical Structure Suggests Further Downside
Analyzing extended timeframes, analyst James Easton presented a 14-day chart illustrating SOL trading within a tightening descending channel. The analysis reveals a pattern of declining peaks and troughs since the high reached in late 2024 through early 2025.
[[TWITTER_EMBED]]Solana previously maintained robust support within the $110 to $120 range. However, this level has now converted into resistance territory. Market analysts note that without reclaiming the $100–$110 zone, downside risk remains elevated, with $60 and subsequently $50 identified as the next substantial demand areas.
Each attempted recovery has thus far been unable to break the pattern of descending highs. With long liquidations exceeding $20 million in just the past day, short position holders maintain an advantageous position should the $78 level fail to provide support.
Get 3 Free Stock Ebooks
Discover top-performing stocks in AI, Crypto, and Technology with expert analysis.
- Top 10 AI Stocks - Leading AI companies
- Top 10 Crypto Stocks - Blockchain leaders
- Top 10 Tech Stocks - Tech giants

