

TLDR
- SUI gained 4% after Google selected it as launch partner for Agentic Payments Protocol
- Bollinger Bands show tightest compression in SUI’s history, matching pre-rally conditions
- Previous similar setups led to 253% and 404% price increases in 2024
- Technical analysis suggests potential targets of $6-8 representing 150-200% upside
- Trading volume jumped 4x during breakout with signs of institutional buying
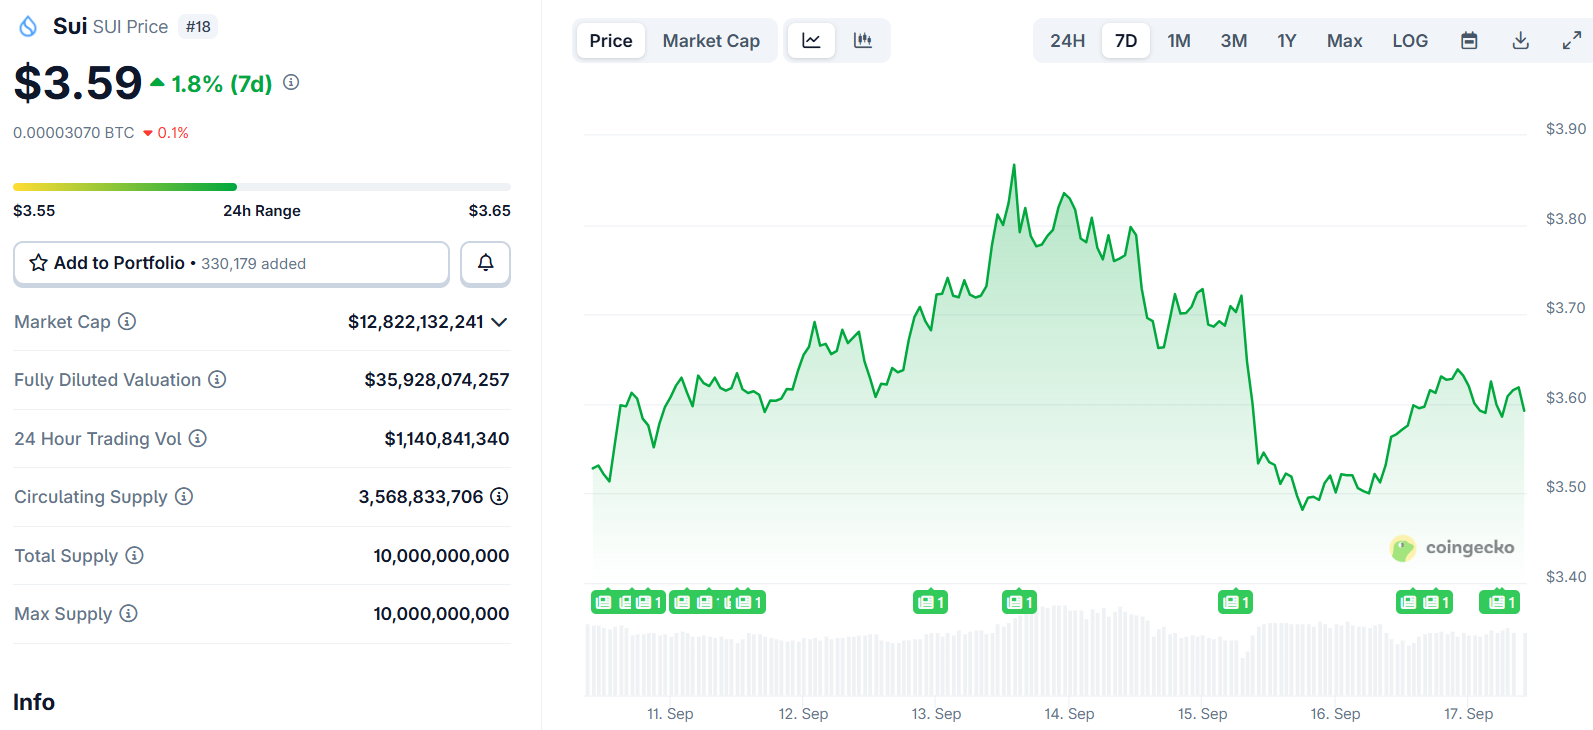
SUI cryptocurrency experienced a 4% price surge following Google’s announcement selecting the blockchain as a launch partner for its new Agentic Payments Protocol. The token moved from $3.509 to $3.622, outperforming the broader crypto market’s 1% gain during the same period.
Google’s Agentic Payments Protocol aims to enable AI agents to conduct financial transactions autonomously for users. This partnership positions SUI as a key infrastructure player in the emerging AI-powered payments space.
The price movement was accompanied by a dramatic increase in trading activity. Volume reached 33.14 million during the breakout, nearly four times the 24-hour average of 8.73 million. This surge, combined with steady bids above $3.50 and higher lows throughout the session, indicates potential institutional accumulation.
Technical Patterns Mirror Previous Major Rallies
Market analyst CryptoBullet identified a striking technical setup on SUI’s chart. The Bollinger Bands have reached their tightest compression in the cryptocurrency’s trading history. This compression level matches exactly with conditions seen before SUI’s two previous explosive rallies.
The Bollinger Band Width indicator currently sits at the same 63 level that preceded major price movements in 2024. In December 2023, SUI consolidated before surging over 253% by March 2024. A similar pattern emerged in September 2024, resulting in a 404% rally over the following months.
The technical setup shows several bullish indicators. The mid-line of the Bollinger Bands has been reclaimed, demonstrating early strength. SUI has also bounced strongly from the 0.618 Fibonacci retracement level, a critical technical support zone.

This tight compression acts like a coiled spring. When volatility contracts to extreme levels, it often precedes major directional moves. The current setup represents the most compressed state in SUI’s entire price history.
Resistance and Support Levels
SUI faced resistance around the $3.65 level during intraday trading, pulling back to $3.57 before settling at $3.60. Buyers later reclaimed the $3.61-$3.65 range as volume tapered off, suggesting some profit-taking occurred.
The next key resistance zone lies between $3.70 and $3.75. A breakout above this level could serve as the catalyst for the larger directional move suggested by the technical analysis.
Support has held firm above $3.50 throughout recent sessions, with institutional-sized orders providing a floor for the price action.
SUI Price Prediction
Based on historical pattern analysis, technical indicators suggest SUI could experience a 150-200% rally if current conditions mirror previous setups. This projection would place price targets between $6 and $8.
The combination of Google partnership fundamentals and technical chart patterns creates a compelling case for upward momentum. Previous instances of similar Bollinger Band compression led to sustained multi-month rallies rather than brief spikes.
Current market conditions show SUI trading at $3.63 with the technical setup positioned for a potential breakout above the $3.75 resistance level.
Get 3 Free Stock Ebooks
Discover top-performing stocks in AI, Crypto, and Technology with expert analysis.
- Top 10 AI Stocks - Leading AI companies
- Top 10 Crypto Stocks - Blockchain leaders
- Top 10 Tech Stocks - Tech giants

