
 Price Past the $2,400 Resistance Level?")
Key Takeaways
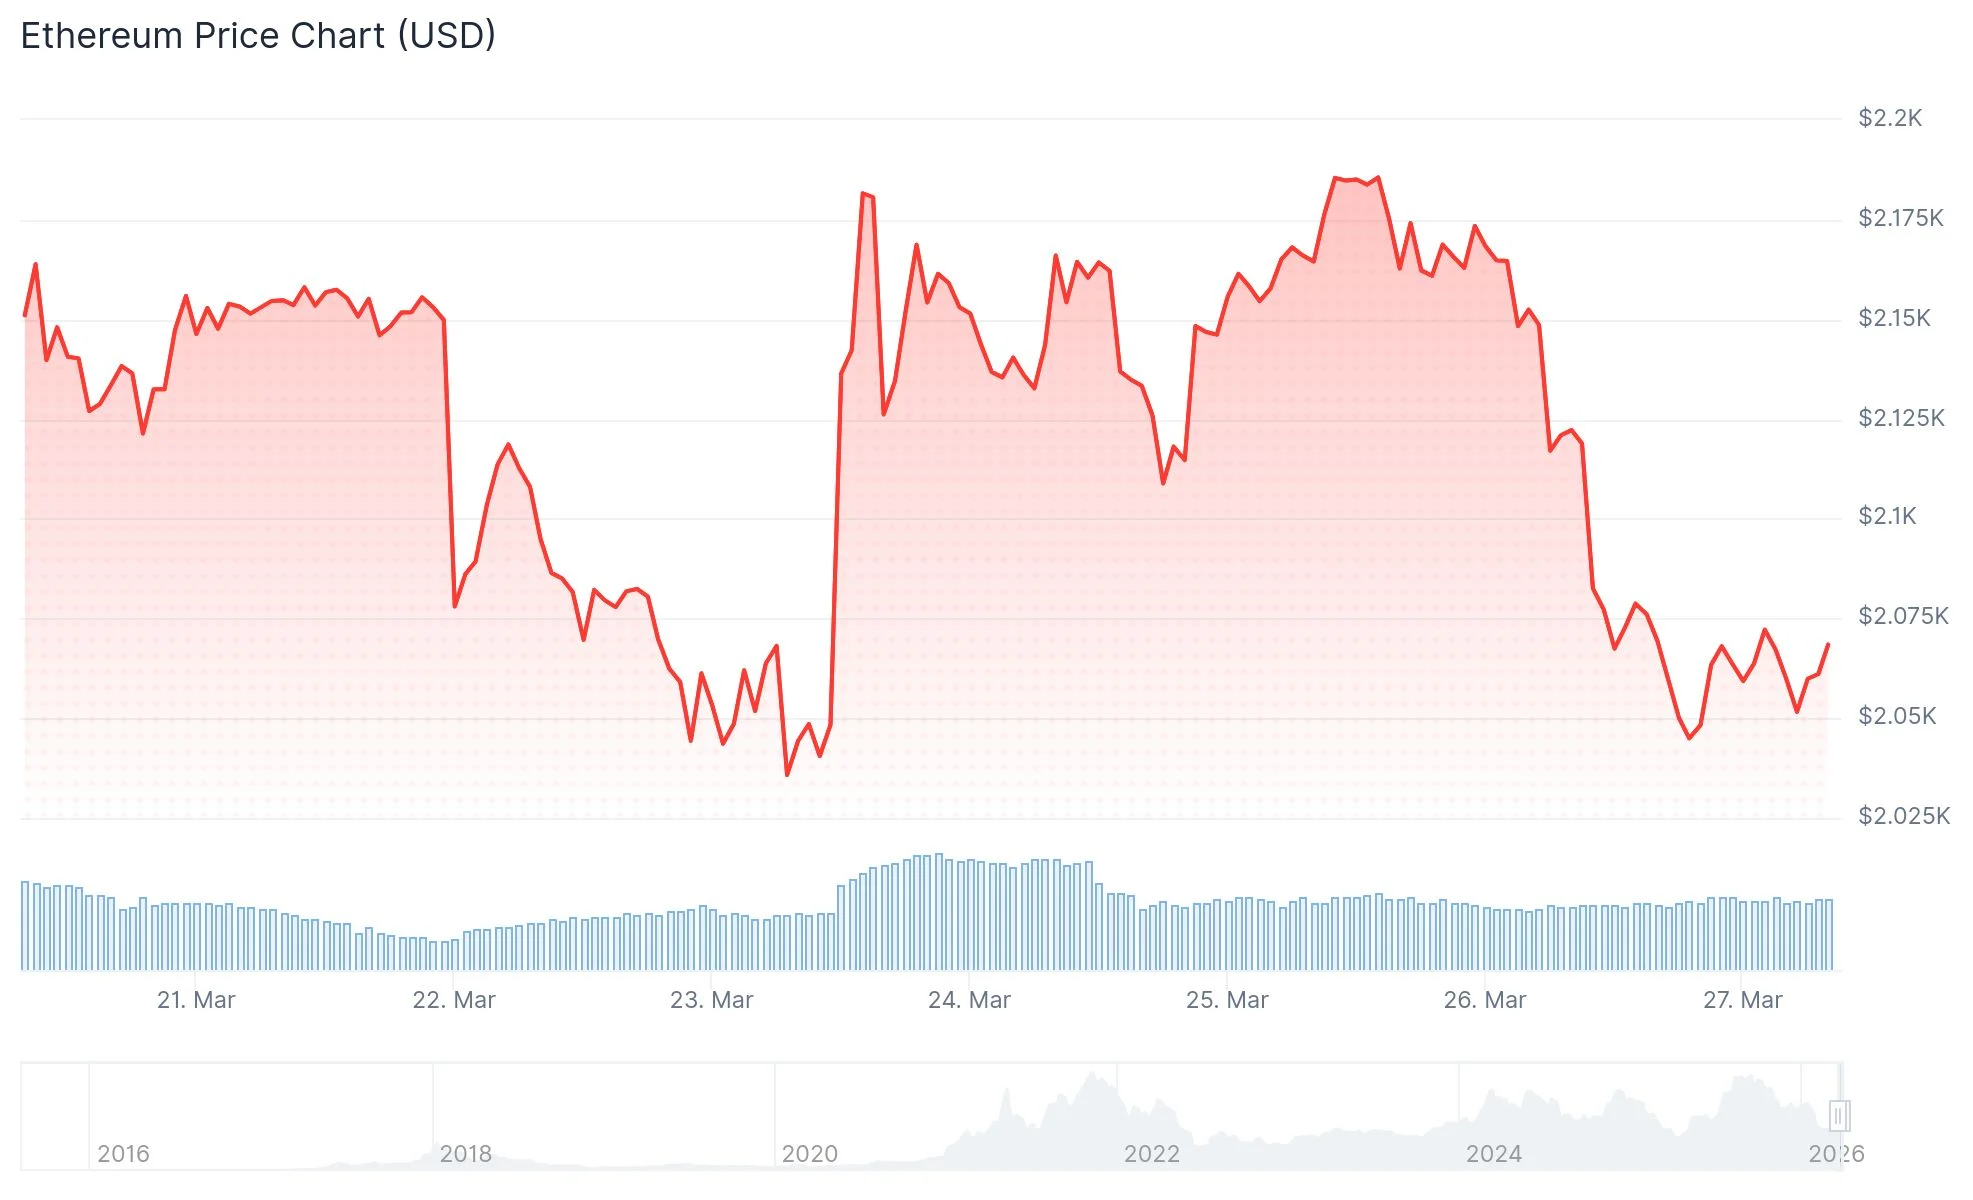
- Ethereum has declined 31% year-to-date, hovering near the $2,066 price point.
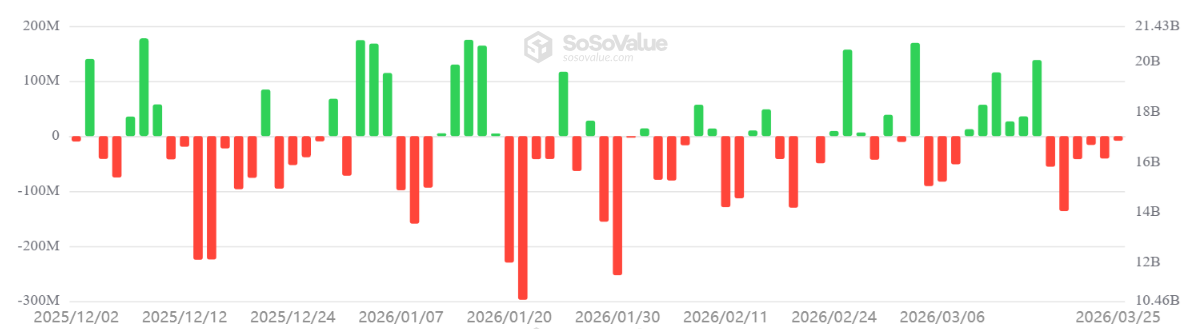
- Spot Ether ETFs in the US have experienced $298 million in net redemptions across six consecutive sessions.
- Decentralized exchange trading volumes on Ethereum have contracted by approximately 50% from Q4 2025 peaks.
- Futures contracts show only a 2% annualized premium, significantly below the healthy 4–8% benchmark.
- Network engagement reached an all-time high with 3.64 million weekly active addresses, while exchange-held supply dropped to decade lows.
Ethereum is currently changing hands around $2,066 following a 6% decline from Wednesday through Thursday, revisiting the critical $2,050 support zone. Since the beginning of 2026, the asset has surrendered 31% of its value.
The downturn mirrors a wider flight from risk assets, partially influenced by geopolitical tensions involving the US, Israel, and Iran. Throughout this timeframe, ETH has lagged behind the broader cryptocurrency market capitalization.
Regulatory challenges are compounding the pressure. US Senate lawmakers are considering legislation to prohibit yield payments on stablecoins deposited at exchanges. While Coinbase has voiced opposition, banking industry representatives contend that existing GENIUS Act provisions already restrict stablecoin issuers from distributing interest directly to token holders.
The Financial Action Task Force recently urged member countries to strengthen stablecoin regulation, highlighting concerns that peer-to-peer transfers and non-custodial wallets complicate the detection of potentially illicit transactions.
ETF Redemptions and Muted Futures Activity Reflect Cautious Sentiment
Since March 18, US-based spot Ethereum ETFs have registered $298 million in net withdrawals spanning six straight trading sessions. Even the protocol’s native staking yield of 2.8% hasn’t been sufficient to reverse bearish sentiment among institutional investors.

Ether futures contracts are currently commanding just a 2% annualized premium relative to spot prices. In balanced market conditions, this metric typically ranges from 4% to 8%. The compressed premium indicates limited bullish conviction from leveraged traders.
Weekly decentralized exchange volumes on the Ethereum network currently average $9.4 billion. This represents roughly half the volume levels observed during the closing quarter of 2025. The sustained decline in on-chain transaction activity continues to suppress demand for ETH in its utility capacity.
Technically, ETH is trading beneath all major exponential moving averages—the 20, 50, 100, and 200-day EMAs. The Relative Strength Index registers below the neutral threshold, while the MACD indicator reflects deteriorating momentum. Critical support exists in the $2,000–$2,050 zone. A decisive breakdown could accelerate selling toward $1,800 or potentially $1,750.
Network Activity Surges While Exchange Balances Shrink
Despite downward price pressure, Ethereum’s underlying network is experiencing unprecedented user engagement. Weekly active addresses climbed to a record 3.64 million, representing a 97% increase year-over-year and a 13% rise over the past month.
Competing networks lag considerably: Polygon PoS recorded 2.84 million active addresses, Base reached 1.99 million, and Arbitrum registered 785,000.
Ethereum balances on centralized exchanges have fallen to their lowest point since 2016. On March 22 specifically, $1.67 billion worth of ETH exited exchange wallets in just 24 hours, signaling accumulation patterns and long-term holding strategies rather than distribution.
Institutional acquisition continues across the corporate landscape. Entities such as BitMine, SharpLink, and The Ether Machine have expanded their ETH positions. Large-value transactions surged from 123 on March 21 to 2,055 on March 24, though whale activity has subsequently normalized to approximately 239 transactions according to the most recent figures.
Get 3 Free Stock Ebooks
Discover top-performing stocks in AI, Crypto, and Technology with expert analysis.
- Top 10 AI Stocks - Leading AI companies
- Top 10 Crypto Stocks - Blockchain leaders
- Top 10 Tech Stocks - Tech giants

