

Key Takeaways
- XRP currently trades at $1.39, experiencing a 3.46% decline over the past 24 hours
- The digital asset maintains stability at the critical $1.40 support threshold following recent downward movement
- A successful breach of the $1.45–$1.50 resistance zone could indicate the beginning of a recovery phase
- The Relative Strength Index stands at 46, beneath the neutral 50 threshold, indicating subdued momentum
- Failure to maintain support above $1.3850 may trigger further decline toward $1.3620 or beyond
XRP maintains its position near a crucial support threshold following sustained selling activity. The cryptocurrency has retreated from its recent peak levels and is currently undergoing consolidation in the vicinity of $1.40.
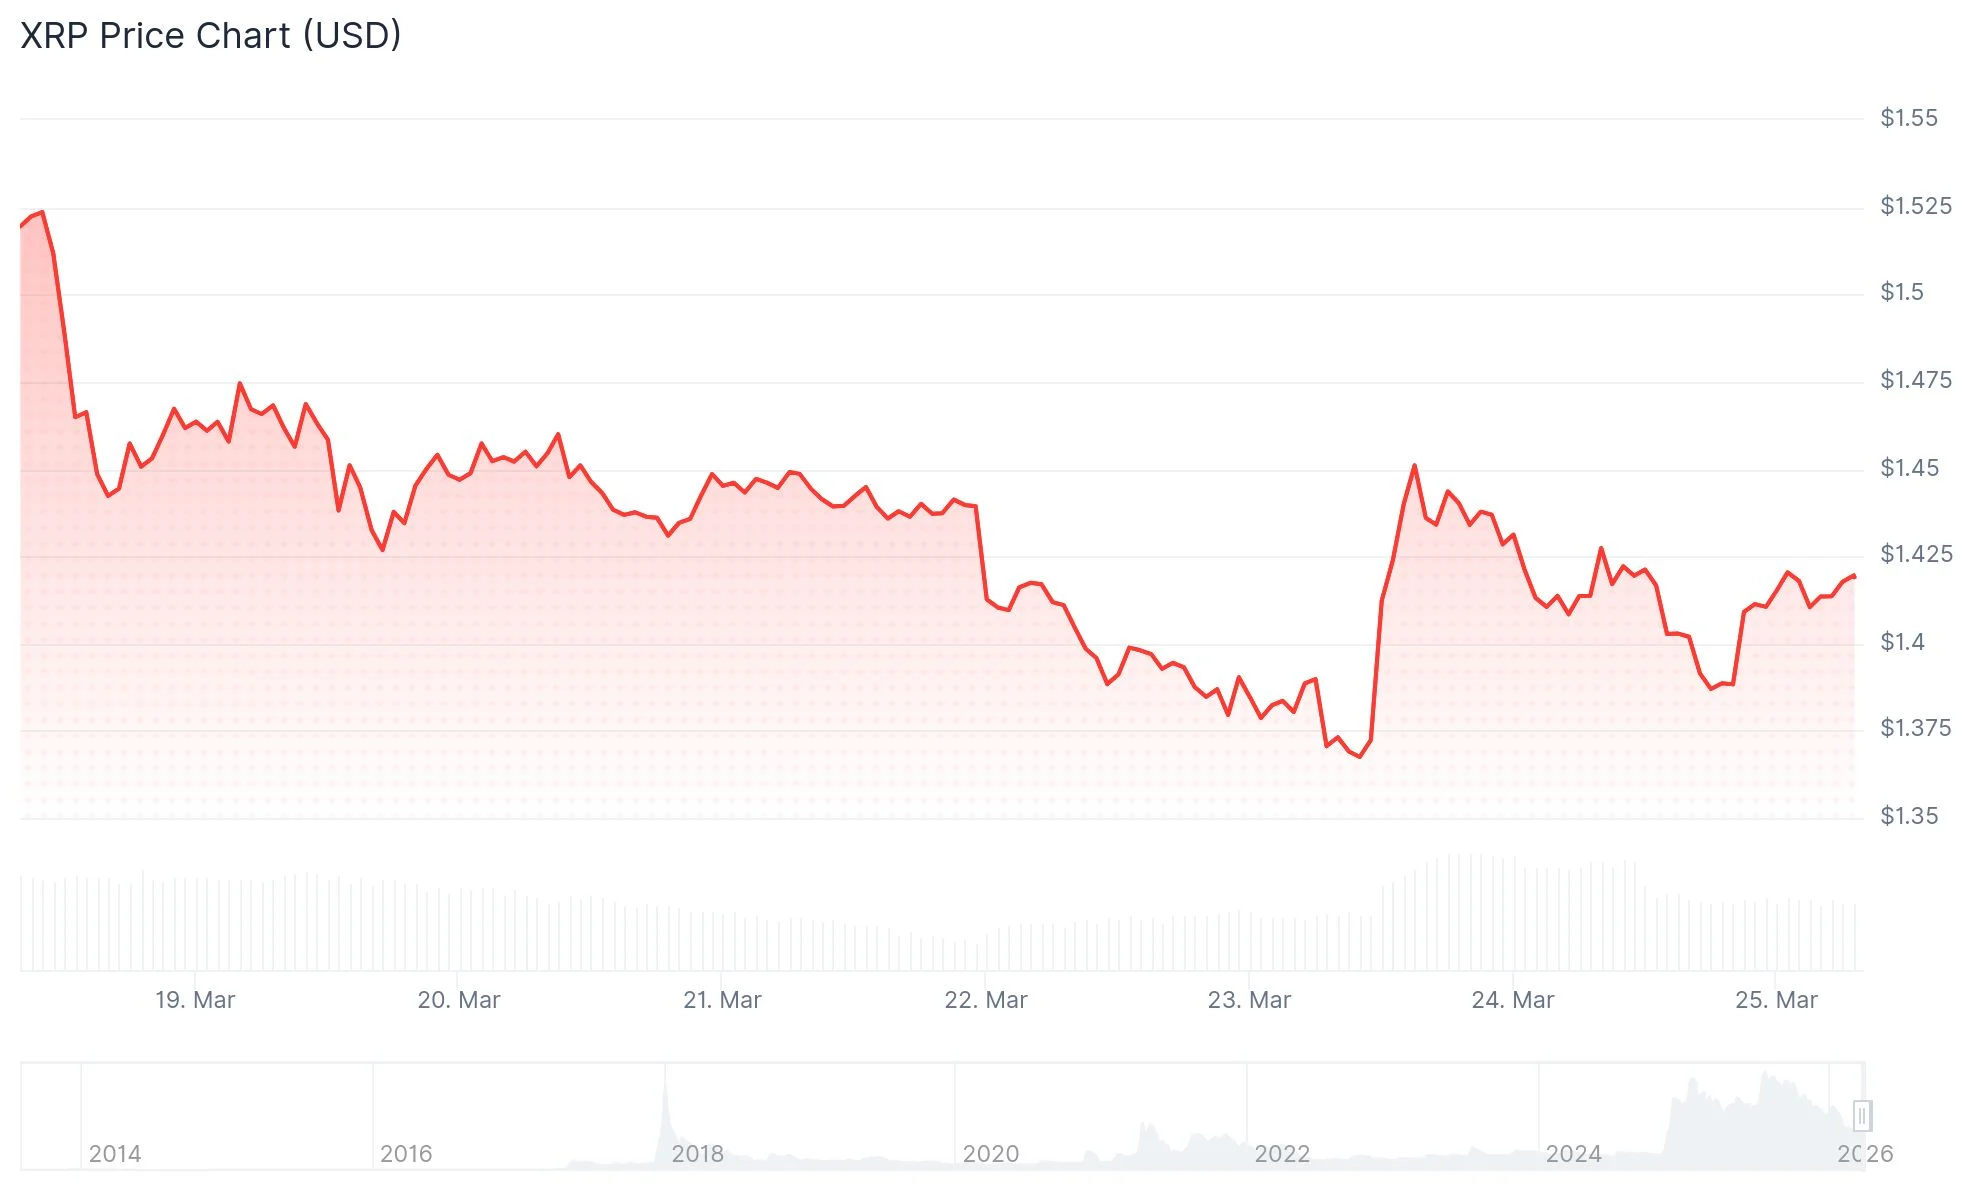
Current market data shows XRP changing hands at $1.39. According to CoinMarketCap, the asset’s trading volume registers at $3.16 billion with a market capitalization of $85.87 billion. The digital currency has experienced a 3.46% decrease over the last day.
The cryptocurrency recently climbed beyond the $1.41 and $1.42 levels before reaching a peak of $1.4650. Following this upward movement, sell-side pressure intensified, causing the price to retreat below both $1.45 and $1.44.
The decline pushed the price beneath the 61.8% Fibonacci retracement level calculated from the upward movement between $1.3612 and $1.4650. Demand emerged around $1.3850, near the 76.4% Fibonacci level, preventing additional downside movement.
Market analyst BitGuru observed on March 24 that XRP is navigating through what he identifies as a significant accumulation zone. According to his assessment, the price movement follows a falling wedge pattern breakdown, with XRP seemingly establishing a foundation around $1.40.

Technical Metrics Suggest Cautious Stance
The Relative Strength Index hovers around 46, remaining beneath the 50 midpoint. This positioning indicates that bearish pressure continues to dominate market sentiment.
XRP is positioned below its 20-day moving average of $1.41 and significantly beneath the 200-day moving average at $2.09. The moving average configuration displays a bearish alignment.
The MACD indicator lines remain horizontal and positioned in negative territory. The absence of a bullish crossover signal indicates that momentum has not yet tilted in favor of buyers.
Critical Price Levels Under Focus
Regarding upside potential, initial resistance emerges near $1.4250. Surpassing this barrier would expose the $1.44 level, followed by $1.4650.
A decisive movement beyond $1.4650 could establish targets at $1.50, with subsequent resistance at $1.5250. Maintaining ground above $1.4250 would be essential for bulls to sustain any upward momentum.
Should XRP struggle to advance higher, initial support lies at $1.40. Additional support levels are positioned at $1.3850, followed by $1.3620.
A daily close beneath $1.3620 might drive the cryptocurrency toward $1.35 or potentially $1.3320.
Market analyst Ali Charts shared observations on X highlighting that a significant trendline may present an attractive accumulation opportunity for XRP, identifying the present support area as a viable entry point.
XRP presently trades above the $1.40 threshold and the 100-hourly Simple Moving Average, with price behavior indicating a cautious approach among market participants.
Get 3 Free Stock Ebooks
Discover top-performing stocks in AI, Crypto, and Technology with expert analysis.
- Top 10 AI Stocks - Leading AI companies
- Top 10 Crypto Stocks - Blockchain leaders
- Top 10 Tech Stocks - Tech giants

