

Key Takeaways
- XRP maintains trading range between $1.32 and $1.35 while exhibiting technical signals that historically indicate cycle lows
- Weekly RSI reached oversold territory at 29 on March 2 and has since climbed to 34
- MACD indicator sits at record lows and approaches a bullish crossover pattern
- Approximately 500 million XRP tokens were purchased near the $1.30 price point, establishing critical support
- A breakdown below $1.27–$1.30 could push price toward $1.15–$1.12, with extreme downside risk at $0.80
After eight consecutive months of declining prices, XRP appears to be exhibiting technical characteristics that have previously signaled significant market bottoms for the digital asset.
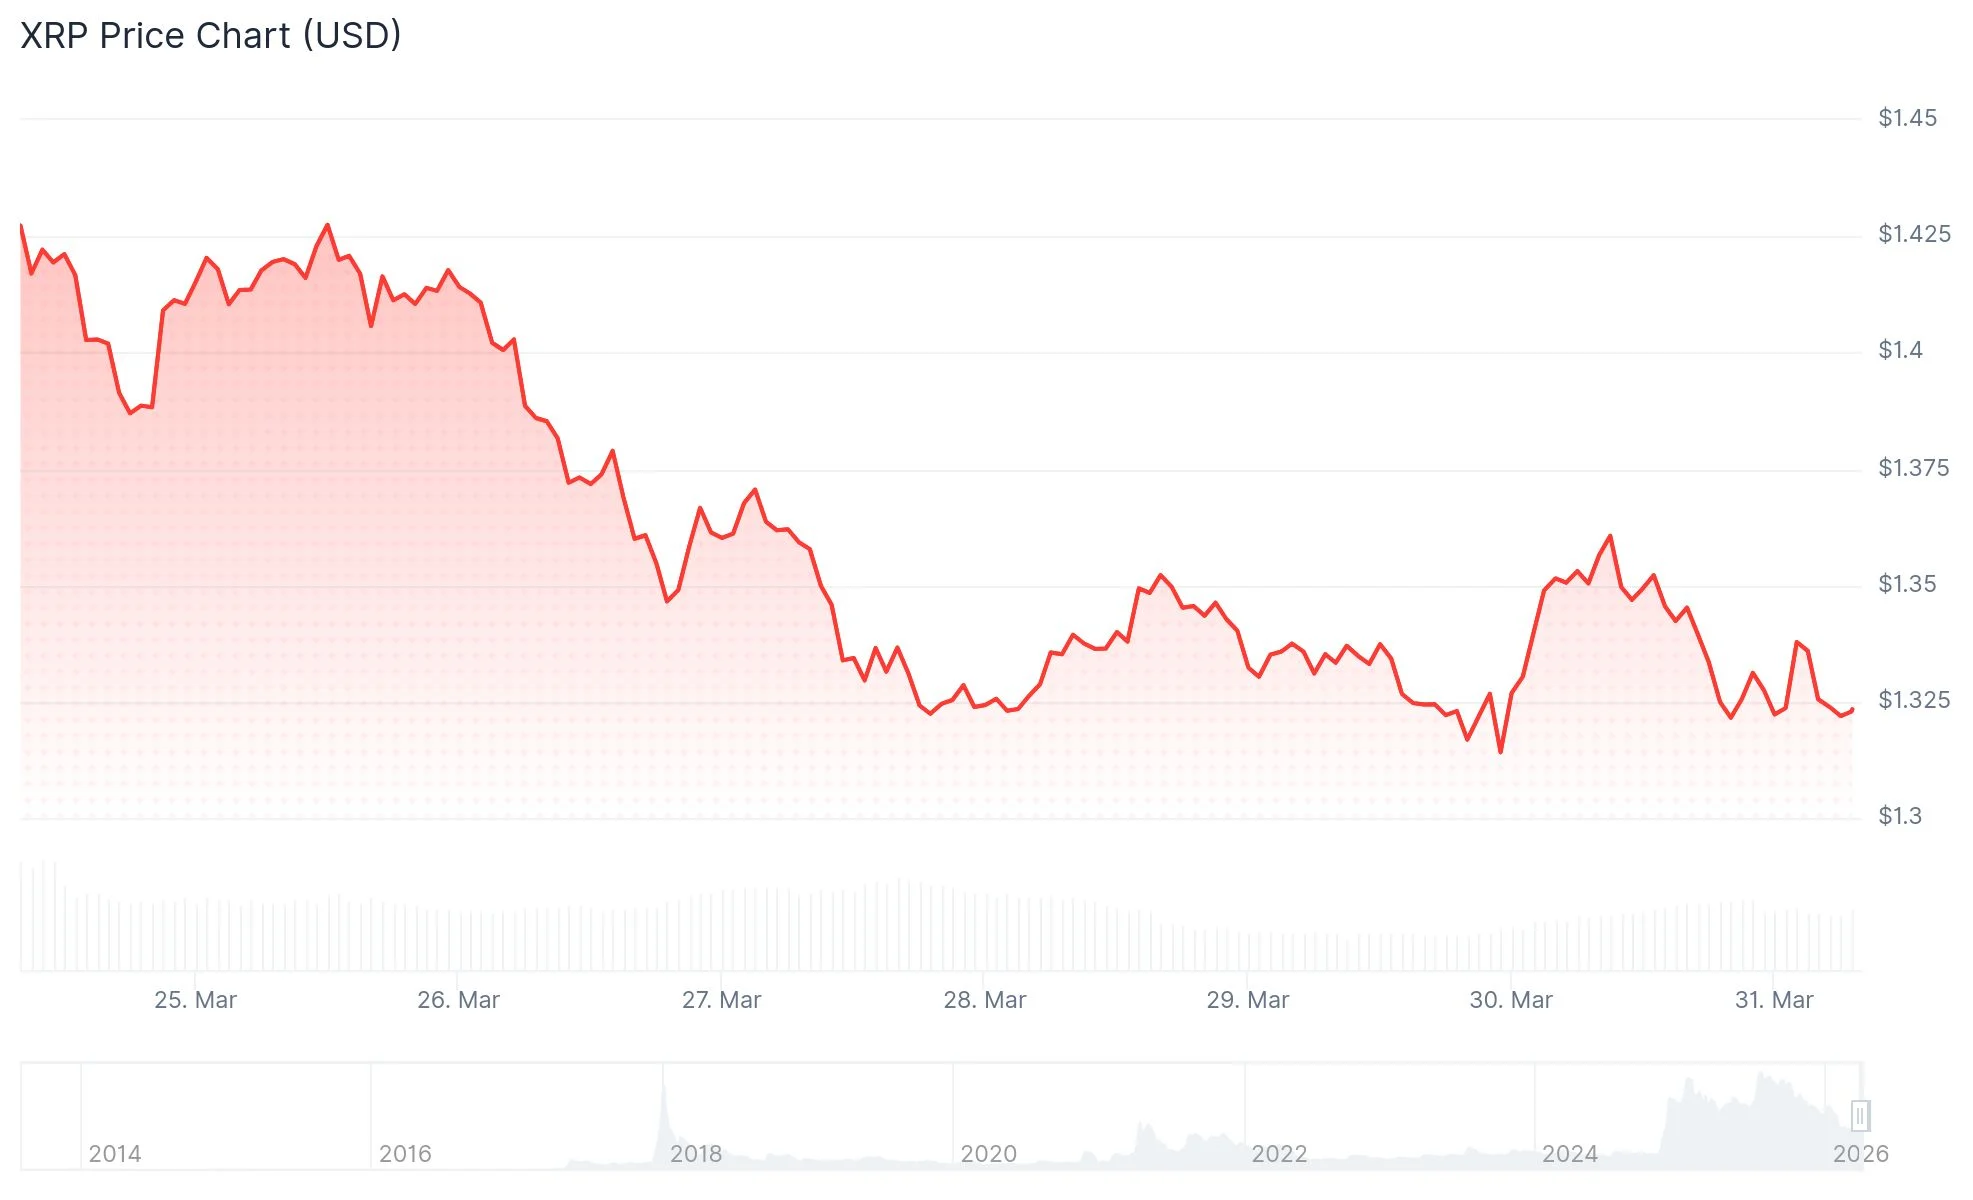
The token currently hovers between $1.32 and $1.35, with market participants focusing intensely on whether buying pressure can maintain the critical $1.30 threshold.
On March 2, the weekly Relative Strength Index plummeted to 29, entering deeply oversold conditions. The indicator has since rebounded to 34. Past instances of XRP reaching similar RSI depths have consistently preceded substantial upward price movements.
Meanwhile, the MACD technical indicator has descended to unprecedented lows in XRP’s trading history. The metric now approaches a bullish crossover formation, a pattern that has consistently coincided with major cyclical bottoms for the cryptocurrency.
Historical data reveals that when these dual conditions converge—an oversold RSI combined with a MACD bullish cross—XRP has generated gains ranging from 74% to 230%. This pattern materialized in 2022 and repeated in mid-2024.

Critical Support Zone at $1.30
Crypto analyst Egrag Crypto characterized the $1.30 region as “a very sensitive level” representing a pivotal juncture where “the market chooses direction.” According to his assessment, maintaining this zone could enable gradual upward movement, while failure to hold could trigger a decline toward $1.15.
Blockchain analytics from Glassnode reveal that close to 500 million XRP tokens were purchased in proximity to the $1.30 price point. This substantial accumulation at a specific cost basis establishes a robust support foundation driven by buyer conviction.
Should the $1.30 level fail, the subsequent support area emerges at $1.15 to $1.12, corresponding with the 200-week simple moving average placement. Breaching this threshold would potentially activate the bear flag projection targeting $0.80.
Market analyst Arthur shared observations on X noting that XRP‘s weekly RSI had reached one of its most depressed readings in recent history, questioning whether the chart was “flashing a long-term bottom signal.” Fellow analyst Cryptoinsightuk highlighted that this represents only the second instance of XRP entering oversold RSI territory, with the inaugural occurrence in July 2022 marking the precise cycle low.
XRP/Bitcoin Ratio Analysis
XRP has also begun to consolidate against Bitcoin near the lower boundary of an extended trading range. The previous occasion when XRP established a bottom versus BTC at this level occurred in June 2025, catalyzing a 56% surge in the XRP/BTC ratio alongside a 92% rally in XRP’s dollar price to $3.66.
Blockchain metrics indicate accelerating whale accumulation activity. Data from analyst Ali Charts demonstrates that whales acquired 190 million XRP tokens during the previous week alone. Simultaneously, elevated exchange outflows suggest a shift toward long-term holding strategies among major investors.
For bulls to validate a trend reversal, XRP must reclaim territory above the $1.61 range high.
Get 3 Free Stock Ebooks
Discover top-performing stocks in AI, Crypto, and Technology with expert analysis.
- Top 10 AI Stocks - Leading AI companies
- Top 10 Crypto Stocks - Blockchain leaders
- Top 10 Tech Stocks - Tech giants

