

Key Takeaways
- XRP maintains position between $1.36 and $1.39, supported by the critical $1.33 level
- Technical analysts identify a symmetrical triangle formation with potential upside to $2.06
- Investment vehicles focused on XRP experienced $30 million in capital exits during the previous week
- The XRP Ledger witnessed a 2.5% weekly increase in stablecoin reserves, reaching $426 million
- Critical price barriers emerge at $1.42, with additional challenges at $1.53 and the $1.75–$1.80 zone
As of March 10, 2026, XRP maintains its position around the $1.37 mark, staging a comeback following a brief decline to $1.34. The digital asset experienced an approximate 8% retraction from its weekly peak of $1.46 before stabilizing.
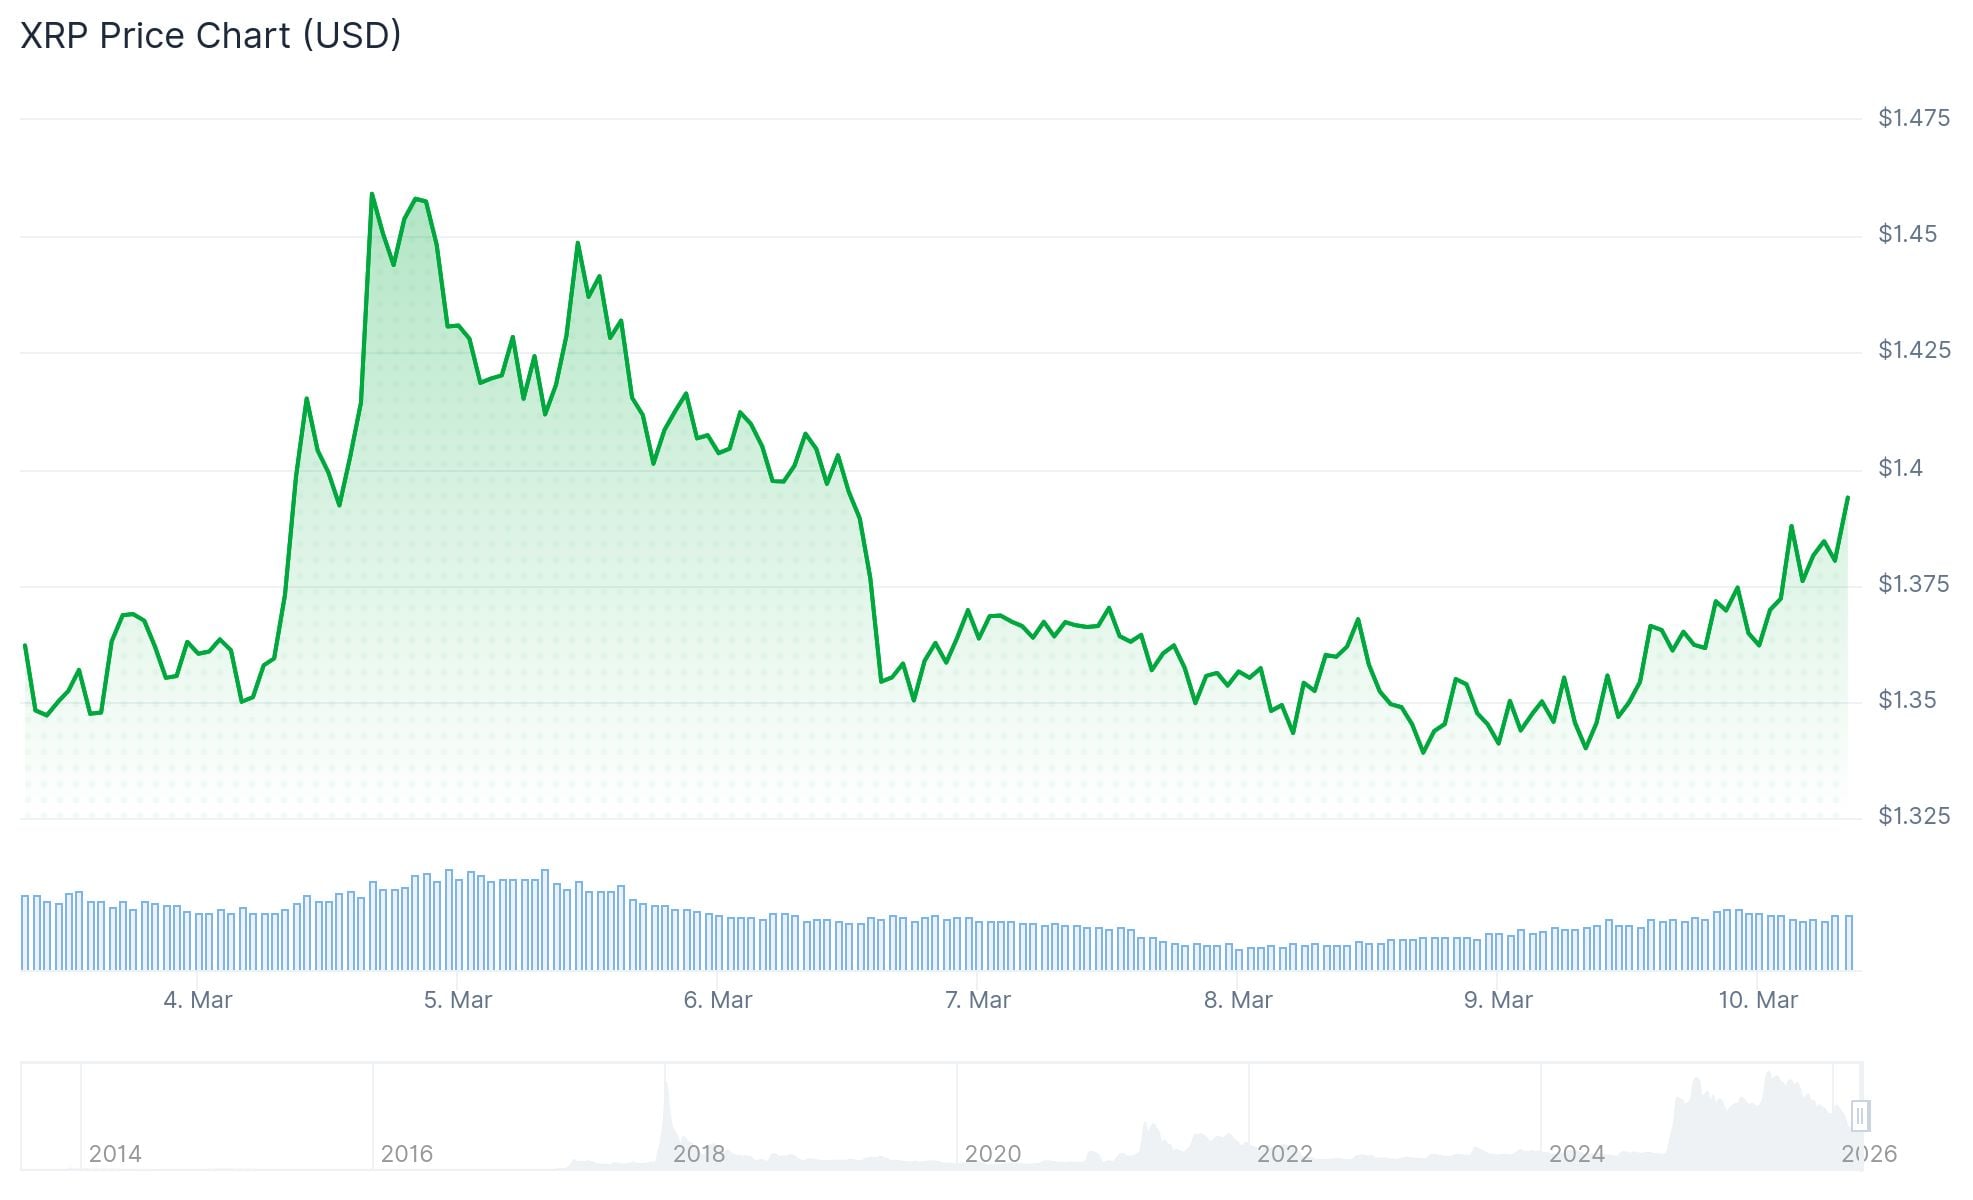
The pullback coincided with Bitcoin’s decline, triggered by mounting inflation worries and escalating Middle Eastern geopolitical uncertainties. On March 10, XRP demonstrated resilience with nearly 4% gains, reaching an intraday peak of $1.39 during Asian market sessions.
Since establishing its all-time high of $3.66 in July, XRP has entered a correction cycle. Weekly chart analysis reveals a pattern of declining peaks and valleys, indicating near-term downward momentum.
However, the diminishing size of recent candlesticks suggests the asset is entering a consolidation phase rather than experiencing continued deterioration.
Triangle Formation Emerges on Daily Charts
Daily price action for XRP reveals the development of a symmetrical triangle configuration. This technical structure emerges when price oscillates between two converging trend boundaries formed by connecting successive highs and lows.

A decisive move above the triangle’s upper boundary would signal bullish momentum. Market technicians are closely monitoring the 23.6% Fibonacci retracement at $1.42 as the initial barrier that must be overcome.
Should XRP successfully breach the $1.42 threshold, the pattern’s projected objective reaches approximately $2.06. This represents a potential 50% appreciation from current trading levels.
Technical indicators provide supporting evidence for a potential reversal. The MACD displays upward momentum, while the RSI exhibits bullish divergence against recent price movements. These signals collectively suggest diminishing bearish pressure.
Market observer JD highlighted on March 9 that XRP continues to respect a long-term ascending support line dating back to early accumulation phases below $0.01. Historical patterns show consistent buying interest at this trendline.
The $3.30–$3.50 range represents a more substantial obstacle for sustained upward movement. Market participants interpret this area either as an ascending triangle resistance or rising wedge formation, depending on analytical perspective.
Investment Flows and Blockchain Metrics
According to CoinShares data, XRP-focused investment vehicles registered $30 million in capital withdrawals during the preceding week. Total managed assets currently stand at approximately $2.4 billion, while year-to-date inflows maintain a positive $123 million balance.
United States spot XRP exchange-traded funds documented $22 million in net redemptions across the past fortnight, interrupting a four-week period of consistent contributions.
Futures Open Interest currently registers $2.25 billion, representing a significant contraction from the July zenith of $10.94 billion.
Conversely, stablecoin reserves on the XRP Ledger expanded 2.5% during the seven-day period to reach $426 million, per DeFiLlama analytics. Increasing stablecoin presence on-chain generally indicates expanding liquidity and heightened network trading volumes.
Near-term support establishes at $1.33. A breach below this threshold could expose the $1.27 level. Upside obstacles are positioned at $1.42, $1.53, and the $1.75–$1.80 corridor.
Get 3 Free Stock Ebooks
Discover top-performing stocks in AI, Crypto, and Technology with expert analysis.
- Top 10 AI Stocks - Leading AI companies
- Top 10 Crypto Stocks - Blockchain leaders
- Top 10 Tech Stocks - Tech giants

