

TLDR
- XRP formed a Golden Cross pattern on the 8-hour chart for the first time in months
- The token broke out of its $2.70-$3.07 consolidation range after weeks of sideways movement
- Technical analysis reveals a completed head-and-shoulders reversal pattern against Ethereum
- Price targets include $3.30, $3.40, $3.65, and potentially $4.50 based on technical projections
- Strong support remains at $2.70 with current resistance around the $3.00 level
XRP has broken free from weeks of sideways trading with the formation of a Golden Cross pattern on its 8-hour chart. This technical development represents the first occurrence of this bullish signal in several months for the cryptocurrency.
The Golden Cross formation occurs when the short-term moving average crosses above the long-term moving average. In XRP’s case, the 23-session moving average has crossed above the MA50, creating this technical configuration.
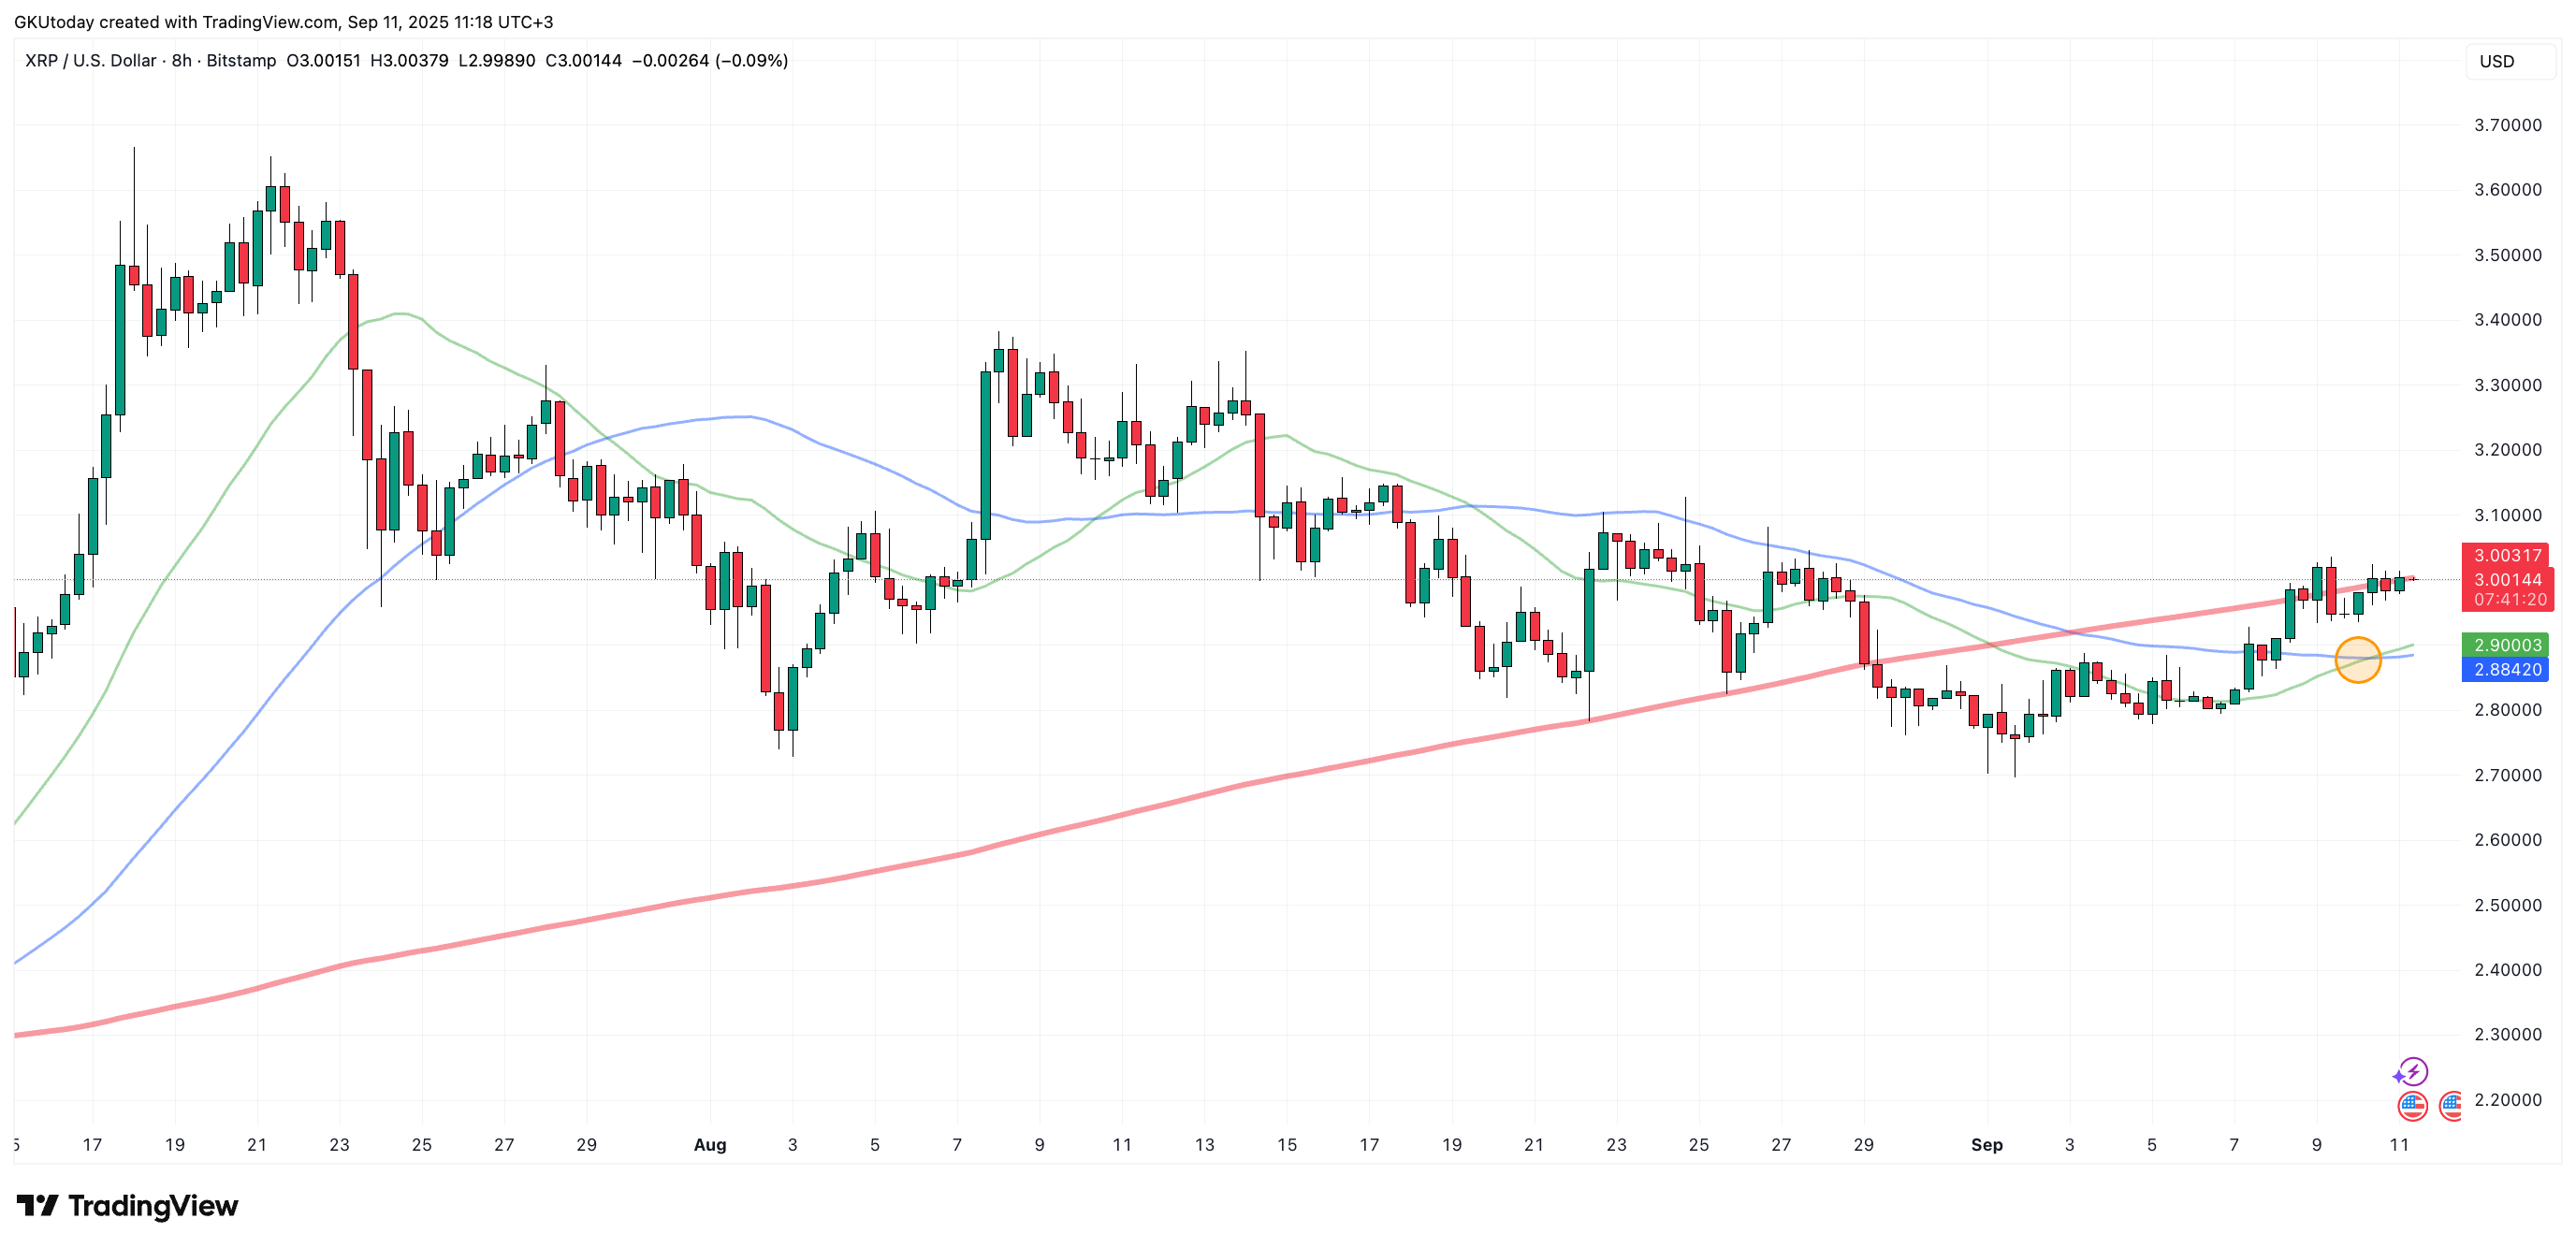
For weeks, XRP remained trapped within a tight trading range between $2.70 and $3.07. The token has now escaped this consolidation phase, generating increased trading activity among market participants.
Historical data indicates that previous Golden Cross formations on XRP charts produced gains of nearly $1 within just a few trading sessions. The current technical setup shows similarities to these past occurrences.
The cryptocurrency maintains strong support at the $2.70 level, which aligns with the MA200. This support zone has provided entry opportunities for short-term buyers throughout the recent consolidation period.
Current resistance sits around $3.00, functioning as an order block that represents the key pivot point for the next potential upward movement. Breaking above this level could trigger further price appreciation.

Key Technical Targets
The first target resistance stands at $3.30, followed by a secondary target at $3.40. These levels represent important barriers that XRP must overcome to establish a more bullish price trajectory.
Technical analysis of the XRP/ETH trading pair reveals additional upside potential. A completed head-and-shoulders reversal pattern against Ethereum suggests XRP’s period of underperformance may be concluding.
Analysts have identified higher targets based on pattern measurements. The first extended target sits at $3.65, derived from the head-and-shoulders pattern analysis on the XRP/ETH pair.
The ultimate target reaches $4.50, calculated by measuring the pattern height and projecting similar moves upward. This level represents substantial upside potential from current price levels.
Market Context and Recent Developments
XRP’s decline against Ethereum followed a classic head-and-shoulders pattern that now appears complete. This technical setup indicates the cryptocurrency may be positioned for a catch-up rally.
The timing aligns with broader market conditions that favor altcoins as Bitcoin and Ethereum consolidate their recent gains. XRP holders who watched their tokens underperform may see improved price action.
Ripple’s legal clarity following its SEC victory created a more favorable regulatory environment for the cryptocurrency. This development removed a major regulatory overhang that previously weighed on price performance.
Expanding cross-border payment partnerships provide fundamental support for XRP’s utility and adoption in the payments sector. These business developments complement the current technical picture.
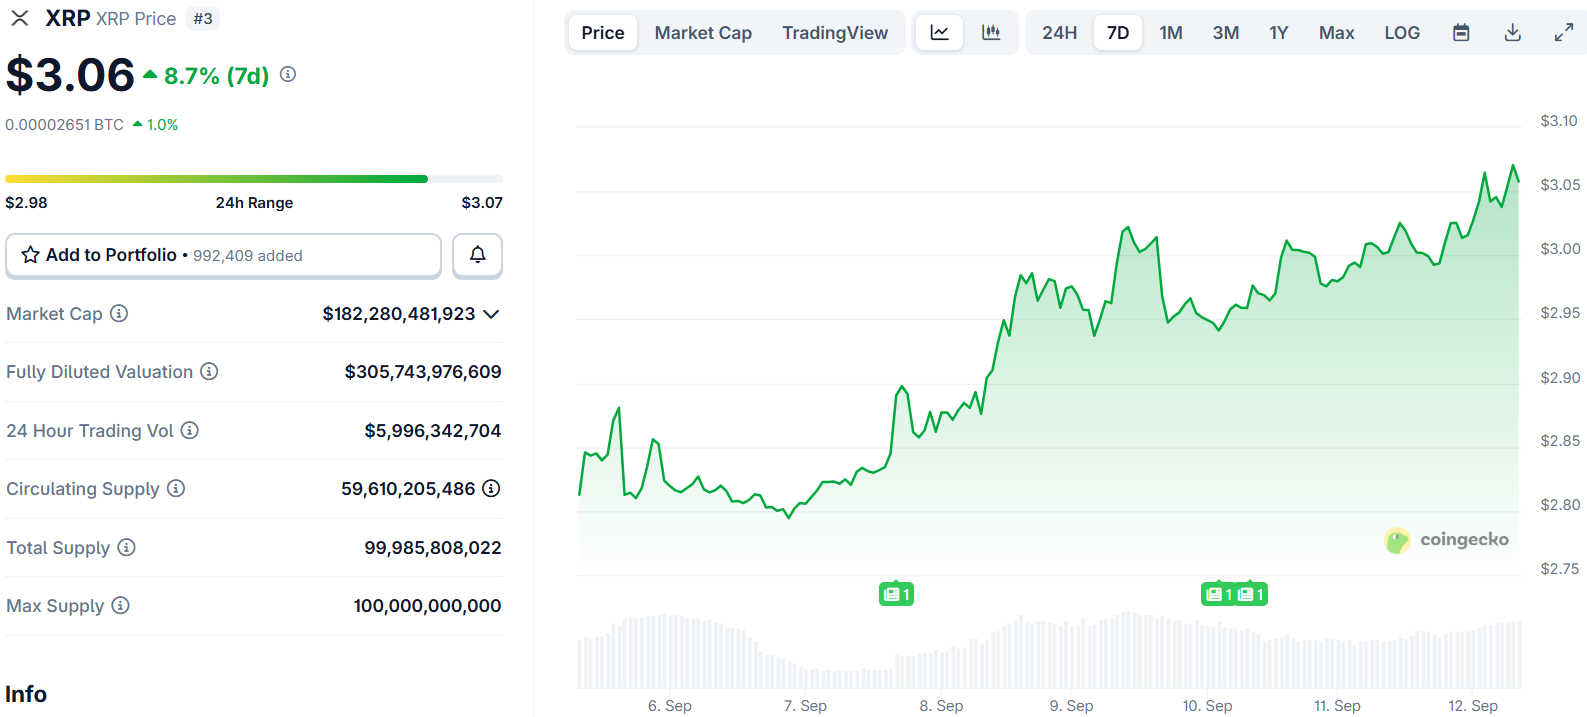
The current market phase shows increasing speculative momentum around XRP as traders position for potential upside moves. Trading volume has increased as the token breaks free from its consolidation pattern.
XRP currently trades around the $3.00 level, testing the key resistance that could determine the next directional move for the cryptocurrency.
Get 3 Free Stock Ebooks
Discover top-performing stocks in AI, Crypto, and Technology with expert analysis.
- Top 10 AI Stocks - Leading AI companies
- Top 10 Crypto Stocks - Blockchain leaders
- Top 10 Tech Stocks - Tech giants

