

TLDR
- XRP price struggles to break $3.00 resistance after recovering from $2.68 support levels
- REX-Osprey XRPR ETF accumulates over $30 million in assets within first three trading days
- Technical charts reveal bullish flag pattern and cup-and-handle formation on daily timeframes
- Current trading occurs near $2.90 with critical support at $2.85 trend line
- Seven additional XRP ETF applications from major firms await potential regulatory approval
XRP price movement has entered a critical phase as the cryptocurrency attempts to overcome resistance levels while institutional interest grows through new investment products. The digital asset recently bounced from support near $2.68 and managed to clear resistance zones at $2.80 and $2.85.
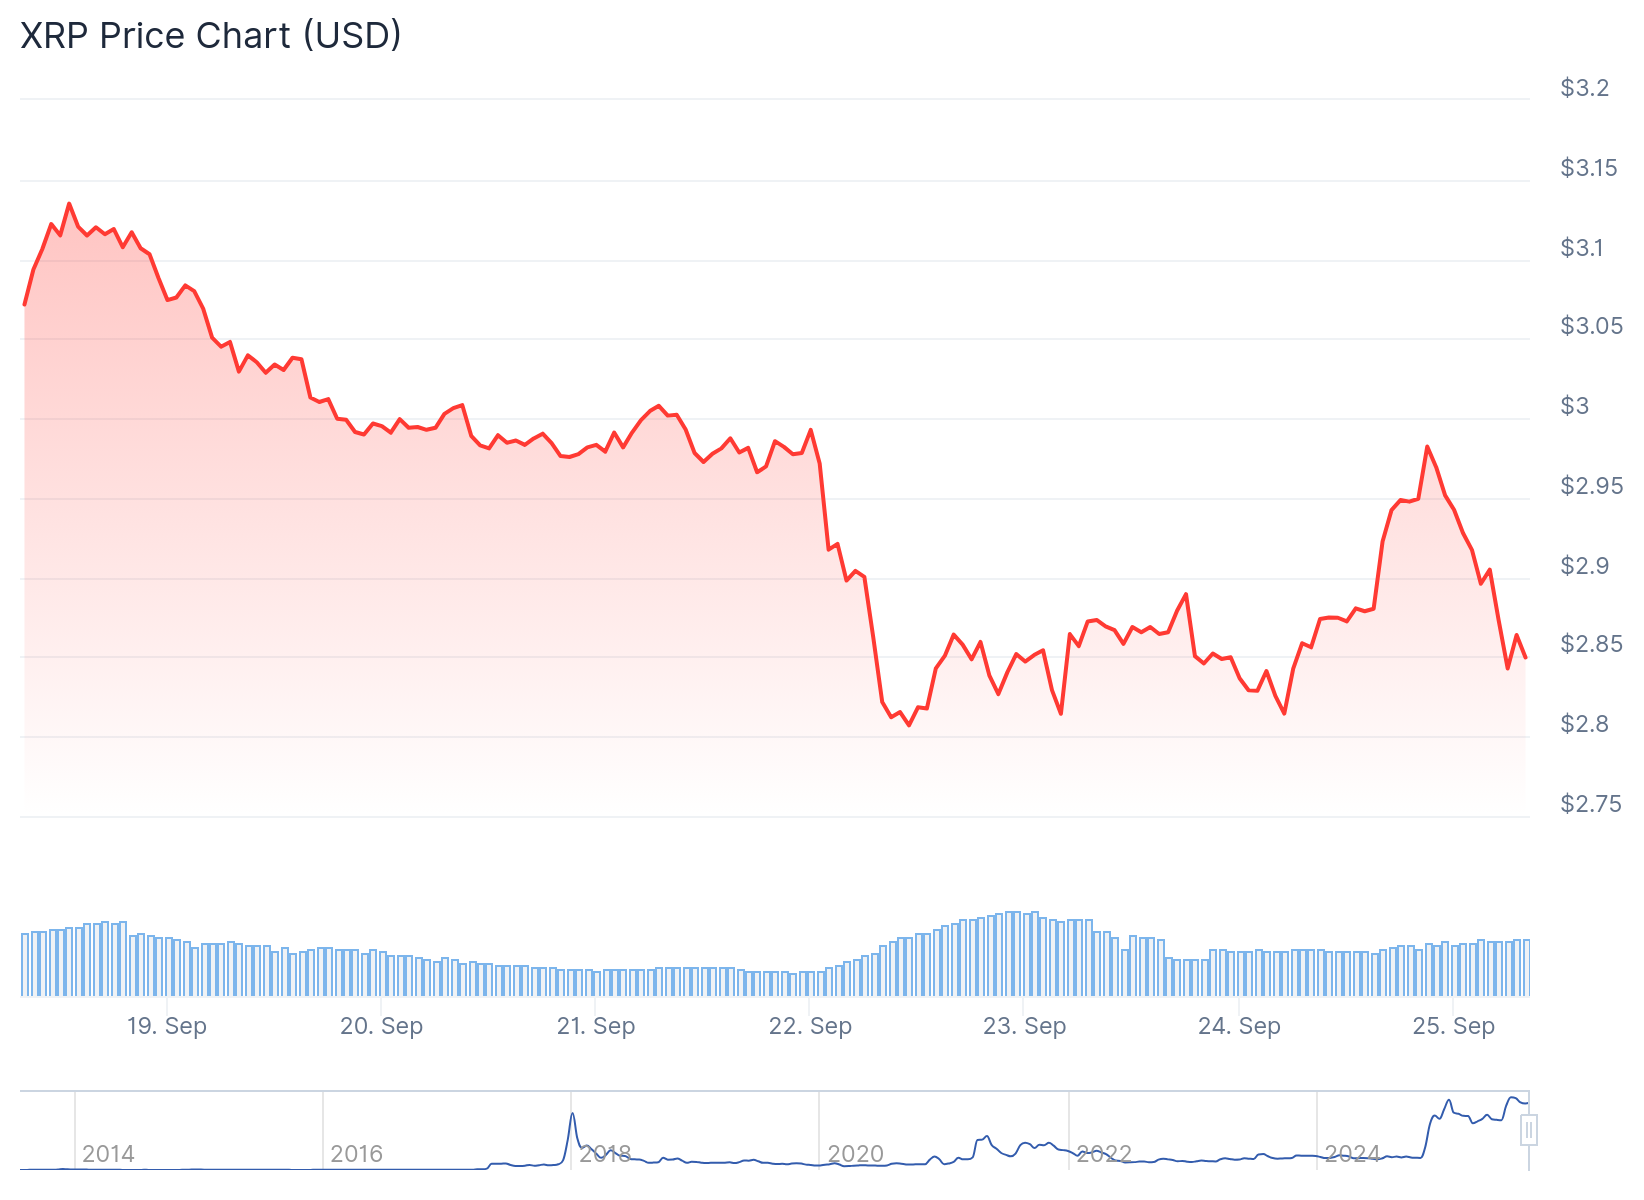
This recovery pushed XRP above the 50% Fibonacci retracement level of its decline from $3.138 to $2.678. However, selling pressure emerged near the $3.00 level, forcing the price to retreat from recent highs.
XRP currently trades around $2.90, hovering near the 100-hourly Simple Moving Average. A bullish trend line provides support at $2.85 on hourly charts, creating a key level for traders to monitor.
ETF Launch Shows Strong Institutional Demand
The cryptocurrency market has witnessed growing institutional participation through the newly launched REX-Osprey XRPR ETF. The fund has accumulated over $30 million in assets during its first three trading days, demonstrating robust investor appetite.
The XRPR ETF operates with a 0.75% expense ratio, charging $750 annually on a $100,000 investment. This compares to BlackRock’s IBIT ETF, which maintains a lower 0.25% fee structure.
Market analysts interpret the ETF’s early performance as a positive signal for seven pending XRP ETF applications from established firms including Grayscale and Fidelity. Industry experts estimate these future funds could attract $8 billion to $10 billion in inflows during their initial year if approved.

The ETF development aligns with Donald Trump’s push to allow retirement accounts like 401k plans to invest in cryptocurrencies. While Bitcoin would likely capture the majority of these flows, analysts expect second-tier digital assets like XRP to benefit from increased institutional allocation.
Technical Analysis Points to Key Decision Levels
Daily chart analysis shows XRP has declined since July due to profit-taking and reduced buying interest. This correction brought the cryptocurrency to important support levels according to Murrey Math Lines methodology.
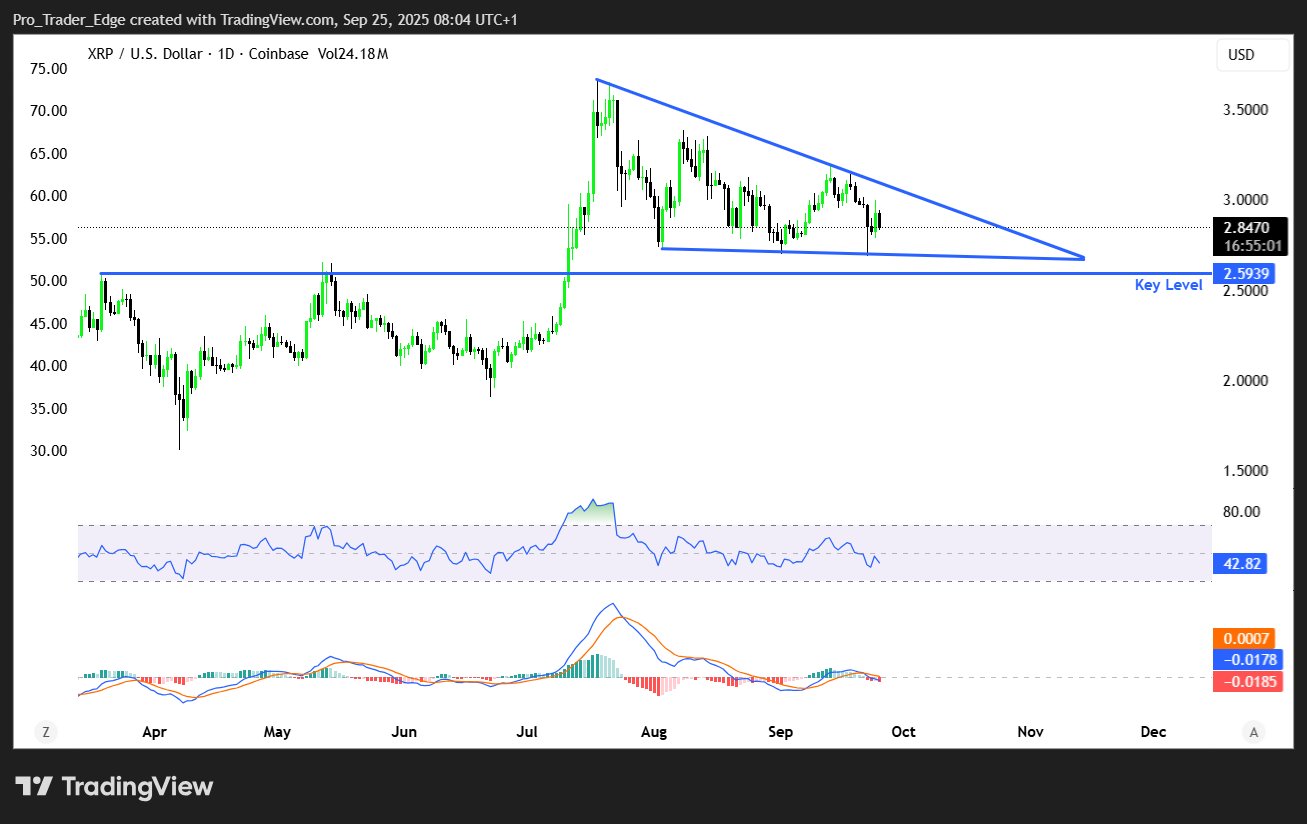
The price action has created a downsloping channel, with boundaries connecting highs and lows since July. This formation contributes to what technical analysts identify as a bullish flag pattern.
Despite recent weakness, XRP maintains its position above the 200-day moving average. The cryptocurrency has also developed a cup-and-handle pattern, traditionally viewed as a bullish continuation signal.
Short-term resistance appears near $2.96, coinciding with the 61.8% Fibonacci retracement level. A successful break above this zone could target the $3.00 resistance area, with further upside potential toward $3.05 and $3.12.
Conversely, failure to overcome resistance could trigger downward movement toward $2.88 support, followed by the critical $2.85 trend line. A breakdown below $2.85 might lead to tests of $2.78 and $2.70 support zones.
Technical indicators present mixed signals for XRP’s near-term direction. The hourly MACD shows bearish momentum, while the RSI has dropped below 50, indicating weakening buying pressure.
The cryptocurrency remains at a pivotal juncture where institutional ETF demand contrasts with technical resistance challenges, setting the stage for the next directional move.
Get 3 Free Stock Ebooks
Discover top-performing stocks in AI, Crypto, and Technology with expert analysis.
- Top 10 AI Stocks - Leading AI companies
- Top 10 Crypto Stocks - Blockchain leaders
- Top 10 Tech Stocks - Tech giants

