

TLDR
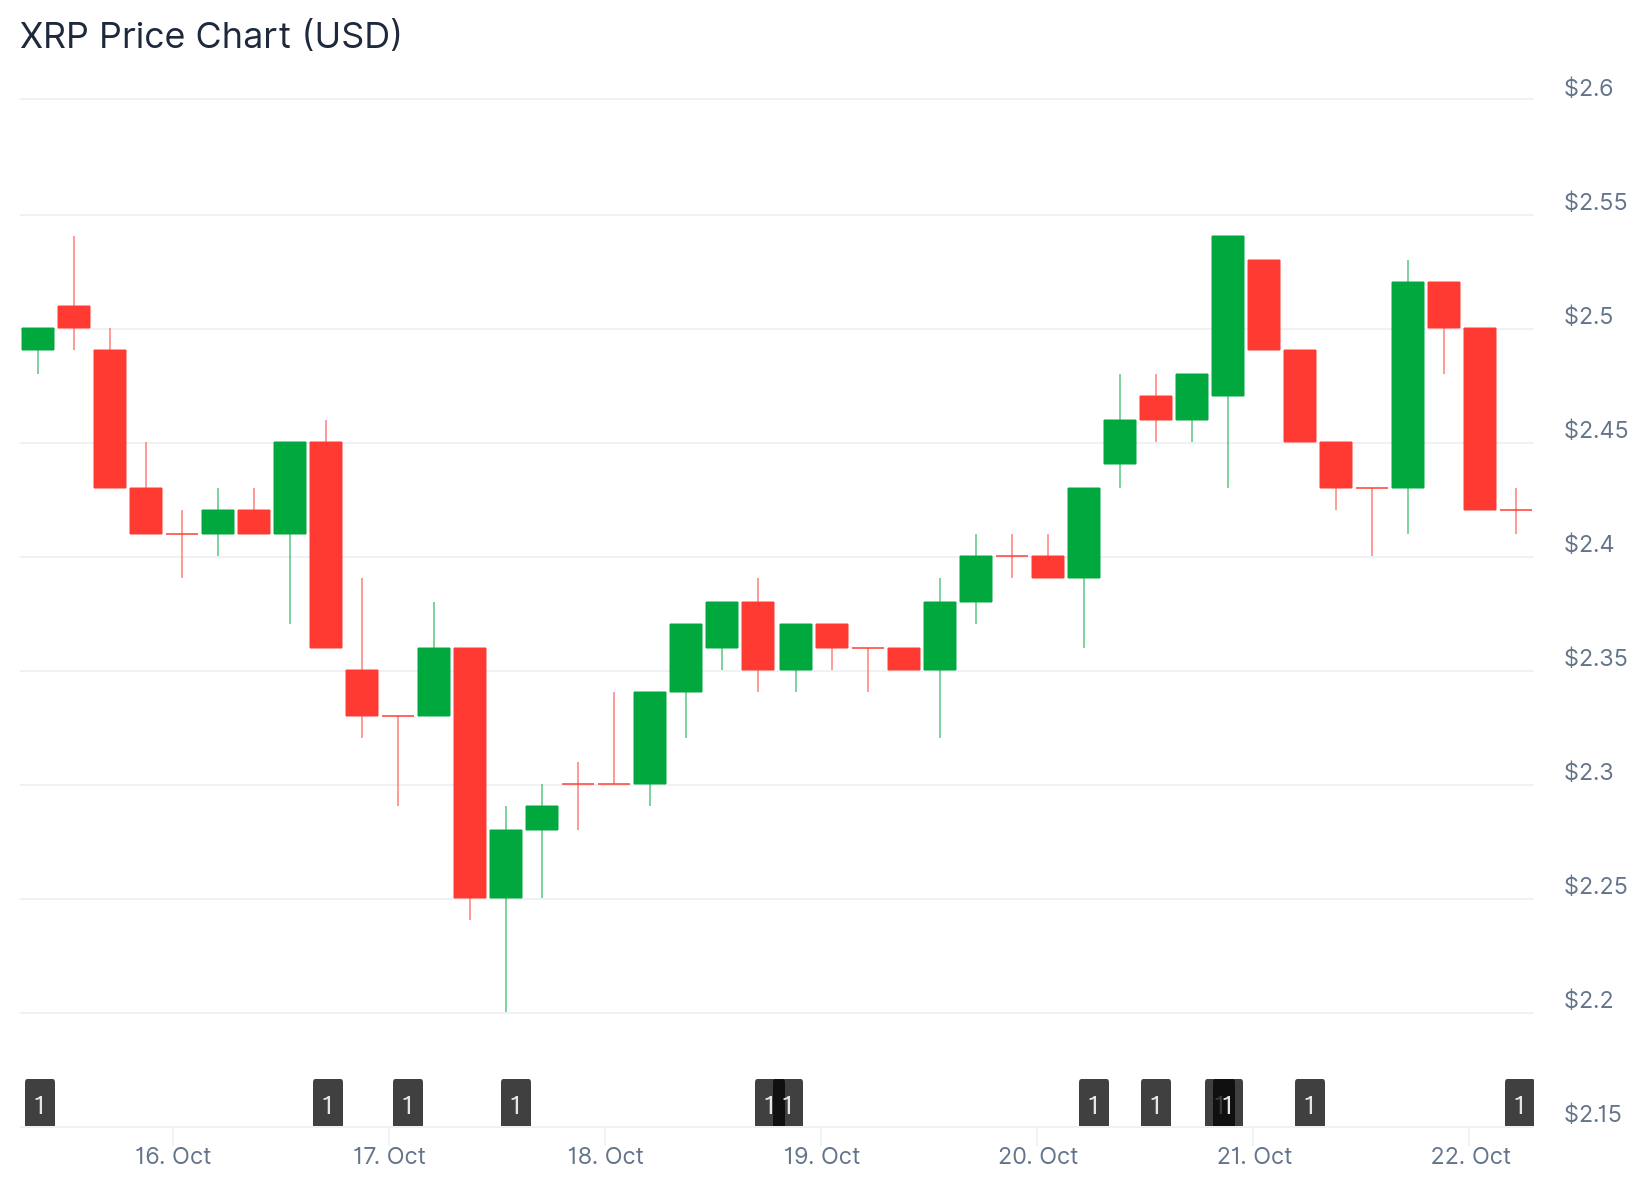
- XRP trades at $2.42 after volatile week with price movements between $2.21 and $2.64, down 1.37% in 24 hours
- Derivatives open interest recovering to historical levels following July liquidation events, indicating renewed market participation
- Token holds $145.25 billion market cap ranking fifth on CoinMarketCap with $5.13 billion daily trading volume
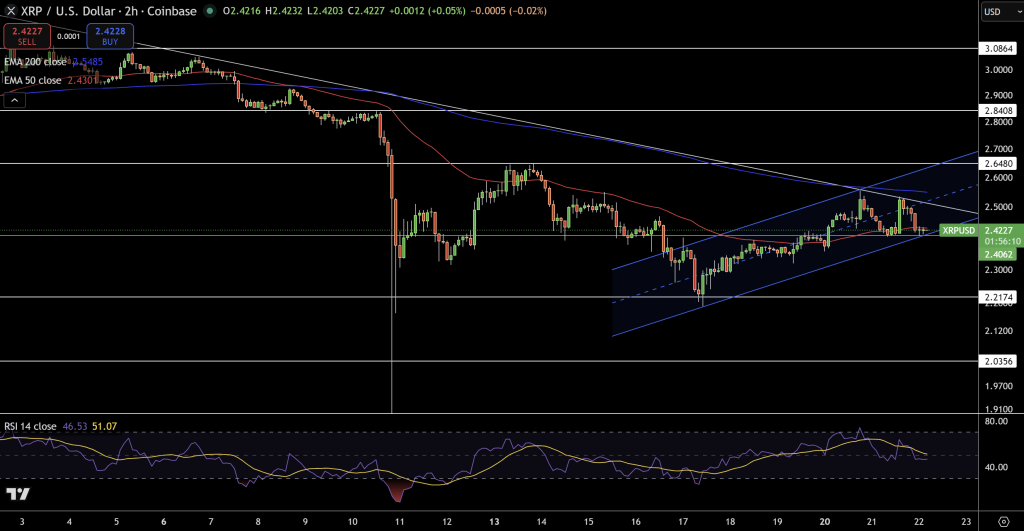
- Critical technical levels at $2.40 support and $2.48 resistance determine next directional move
- Rising channel consolidation pattern shows market waiting for breakout with RSI at neutral 46
XRP is trading at $2.42 following a volatile week that saw prices fluctuate between $2.21 and $2.64. The token experienced a 1.37% decline in the past 24 hours.
The price has reclaimed the $2.40 Point of Control level, a key volume-based technical marker. This level represents a high-volume node where significant trading activity has occurred.
XRP maintains its position as the fifth-largest cryptocurrency by market capitalization at $145.25 billion. Trading volume reached $5.13 billion over the past 24 hours.
The token is currently consolidating within a rising channel pattern. This technical formation indicates traders are awaiting a clear directional signal before committing to new positions.
Buyers defended the recent retest of the value area low. This price action prevented a deeper pullback and established $2.40 as a structural support zone.
The formation of higher lows demonstrates continued buying interest. However, momentum has decreased as price action remains near the channel’s midpoint.

Technical Indicators Show Market Indecision
XRP is positioned between two key moving averages. The 50-day exponential moving average sits at $2.43 while the 200-day EMA is located at $2.54.
This placement creates tension between short-term traders and long-term position holders. The Relative Strength Index reads 46, showing a slightly bearish tilt but remaining largely neutral.
Chart patterns including Doji and spinning tops are appearing with increased frequency. These candlestick formations signal market indecision as participants wait for a confirmed breakout or breakdown.
The October trendline continues serving as overhead resistance. Any upward movement will require strong volume to validate a sustainable breakout attempt.
Derivatives Data Points to Recovery
Open interest on major futures exchanges has climbed back following July’s liquidation cascade. Those events eliminated excessive leverage positions from the market.
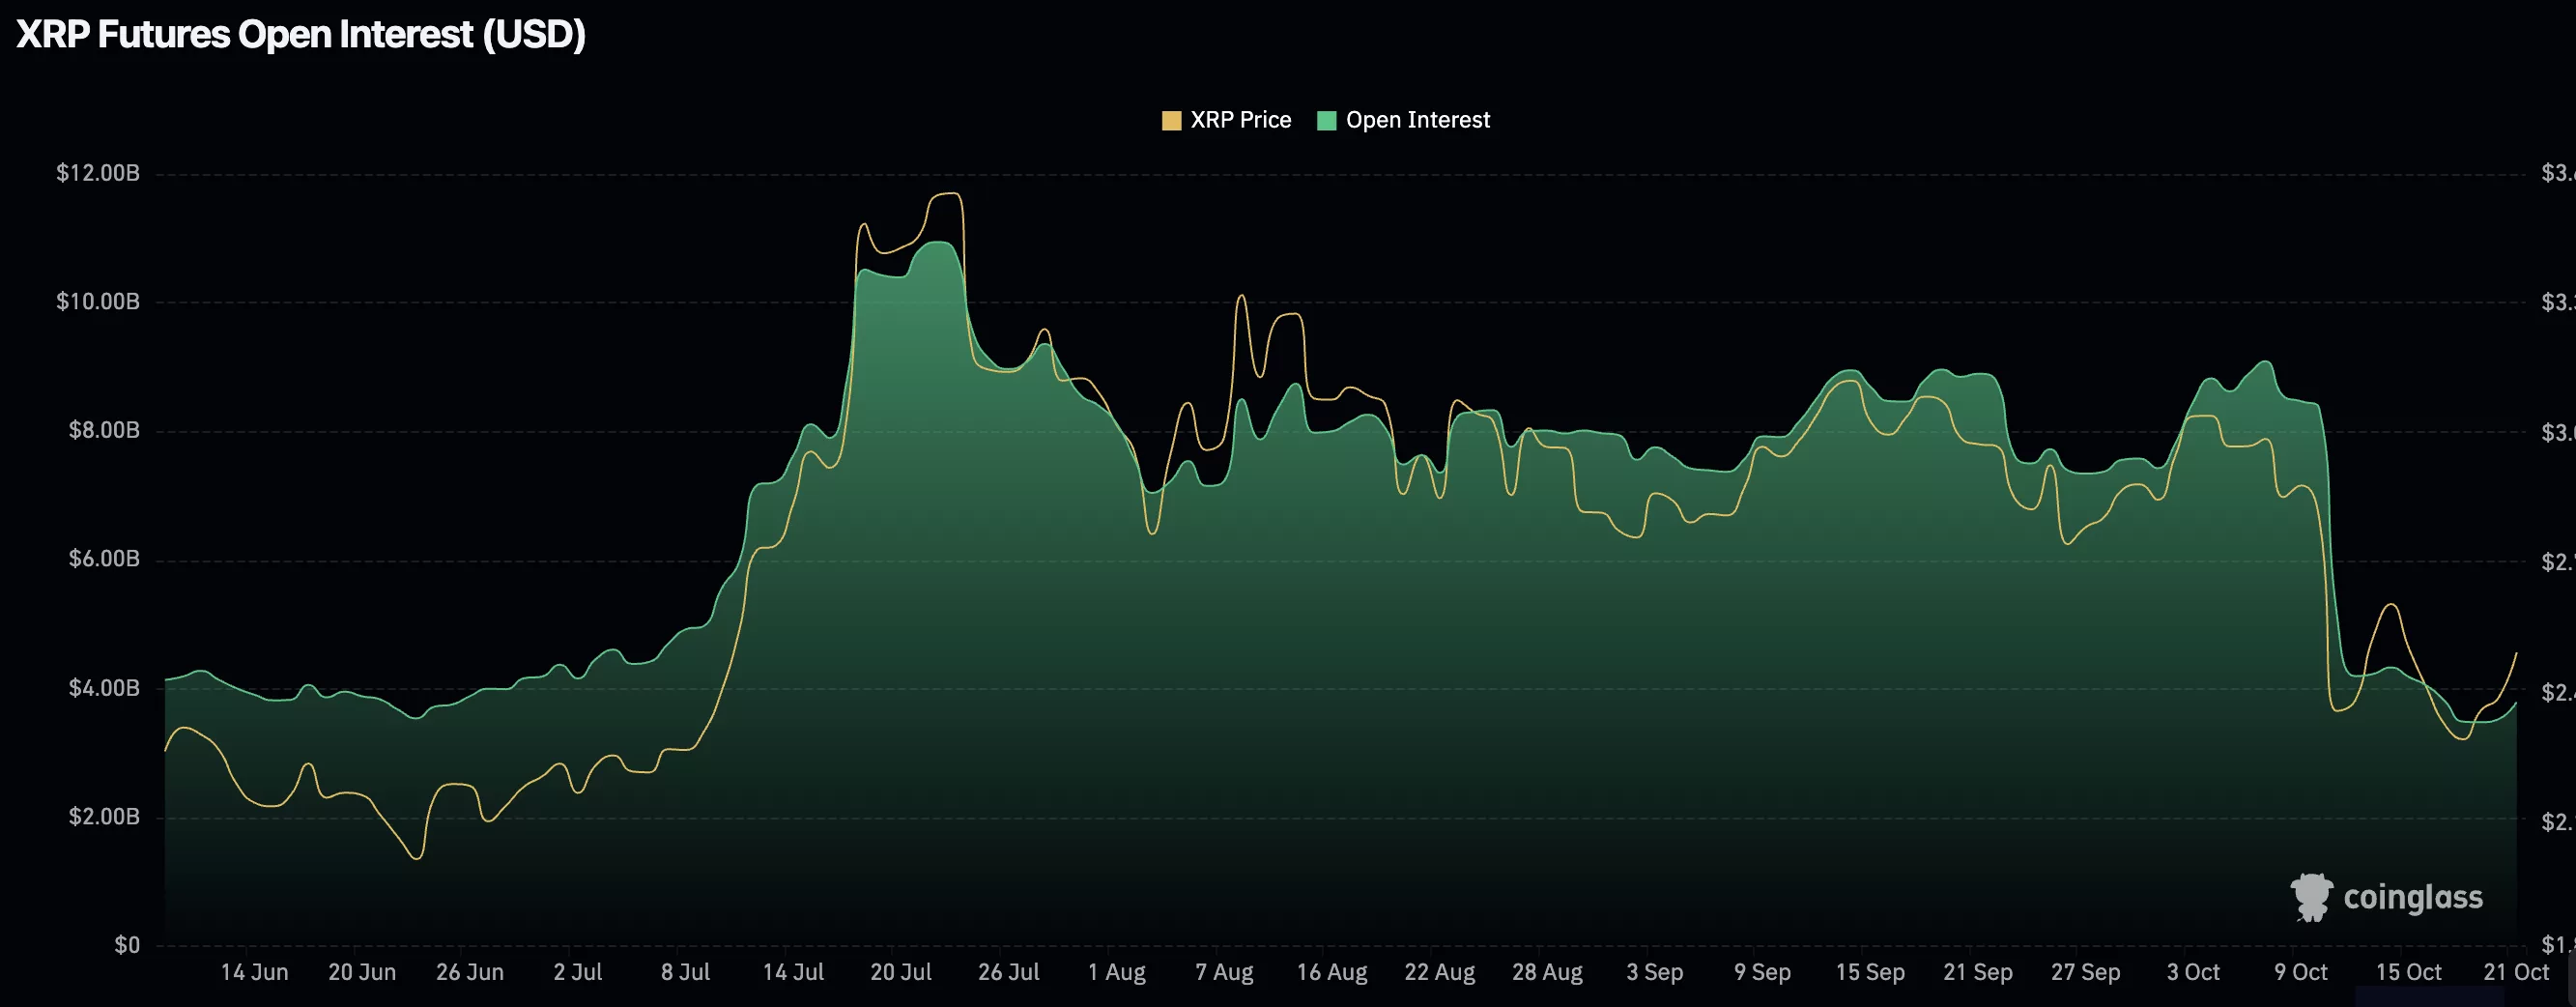
The simultaneous rise in both open interest and price suggests genuine market interest. This pattern differs from speculative overleveraging that preceded the July reset.
Continued growth in open interest while price holds above $2.40 would confirm new long position establishment. Historical data shows this combination often precedes extended rallies when accompanied by stable funding rates.
The derivatives market recovery represents a shift in trader sentiment. Market participants are returning with more measured positioning after the July shakeout.
Key Price Levels for Traders
A breakout above $2.48 resistance could trigger buying pressure toward $2.64 and $2.70 targets. The upper channel boundary would provide additional support for these moves.
A close beneath $2.40 would compromise the current structure. Support would then shift to $2.21, where buying interest may resurface at this psychological level.
Traders are watching for confirmation above $2.48 with entry zones between $2.40 and $2.45. Risk management suggests stop losses below $2.37.
Daily closes above $2.40 maintain the constructive price structure. The token’s ability to hold this level determines whether recent strength continues into further gains.
Price currently sits at $2.42 with open interest data supporting potential upside continuation if support levels hold.
Get 3 Free Stock Ebooks
Discover top-performing stocks in AI, Crypto, and Technology with expert analysis.
- Top 10 AI Stocks - Leading AI companies
- Top 10 Crypto Stocks - Blockchain leaders
- Top 10 Tech Stocks - Tech giants

