

TLDR
- XRP is currently priced at $2.40, representing a 23% decline from its October peak and a 35% drop from yearly highs
- Technical charts display an inverse head-and-shoulders formation with the head at $2.20 and left shoulder at $2.32
- The REX-Osprey XRP ETF has accumulated over $100 million in assets with daily inflows since launching in September
- Ripple’s RLUSD stablecoin holds $874 million in assets and is closing in on the $1 billion mark
- Critical resistance stands at $2.42 and $2.50, while key support zones are found at $2.32 and $2.27
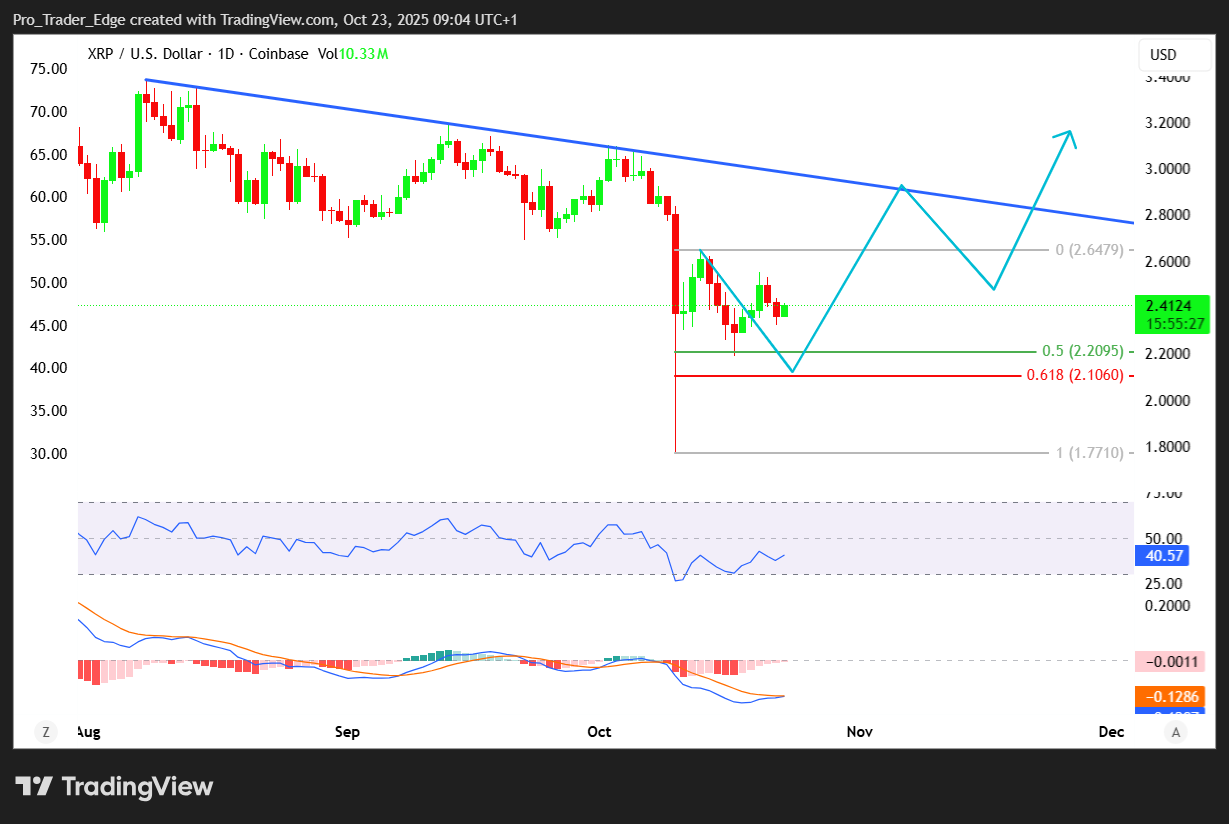
XRP is trading at $2.40 as of October 22, marking a 23% decline from its monthly high. The cryptocurrency has experienced a 35% decrease from its peak earlier this year.
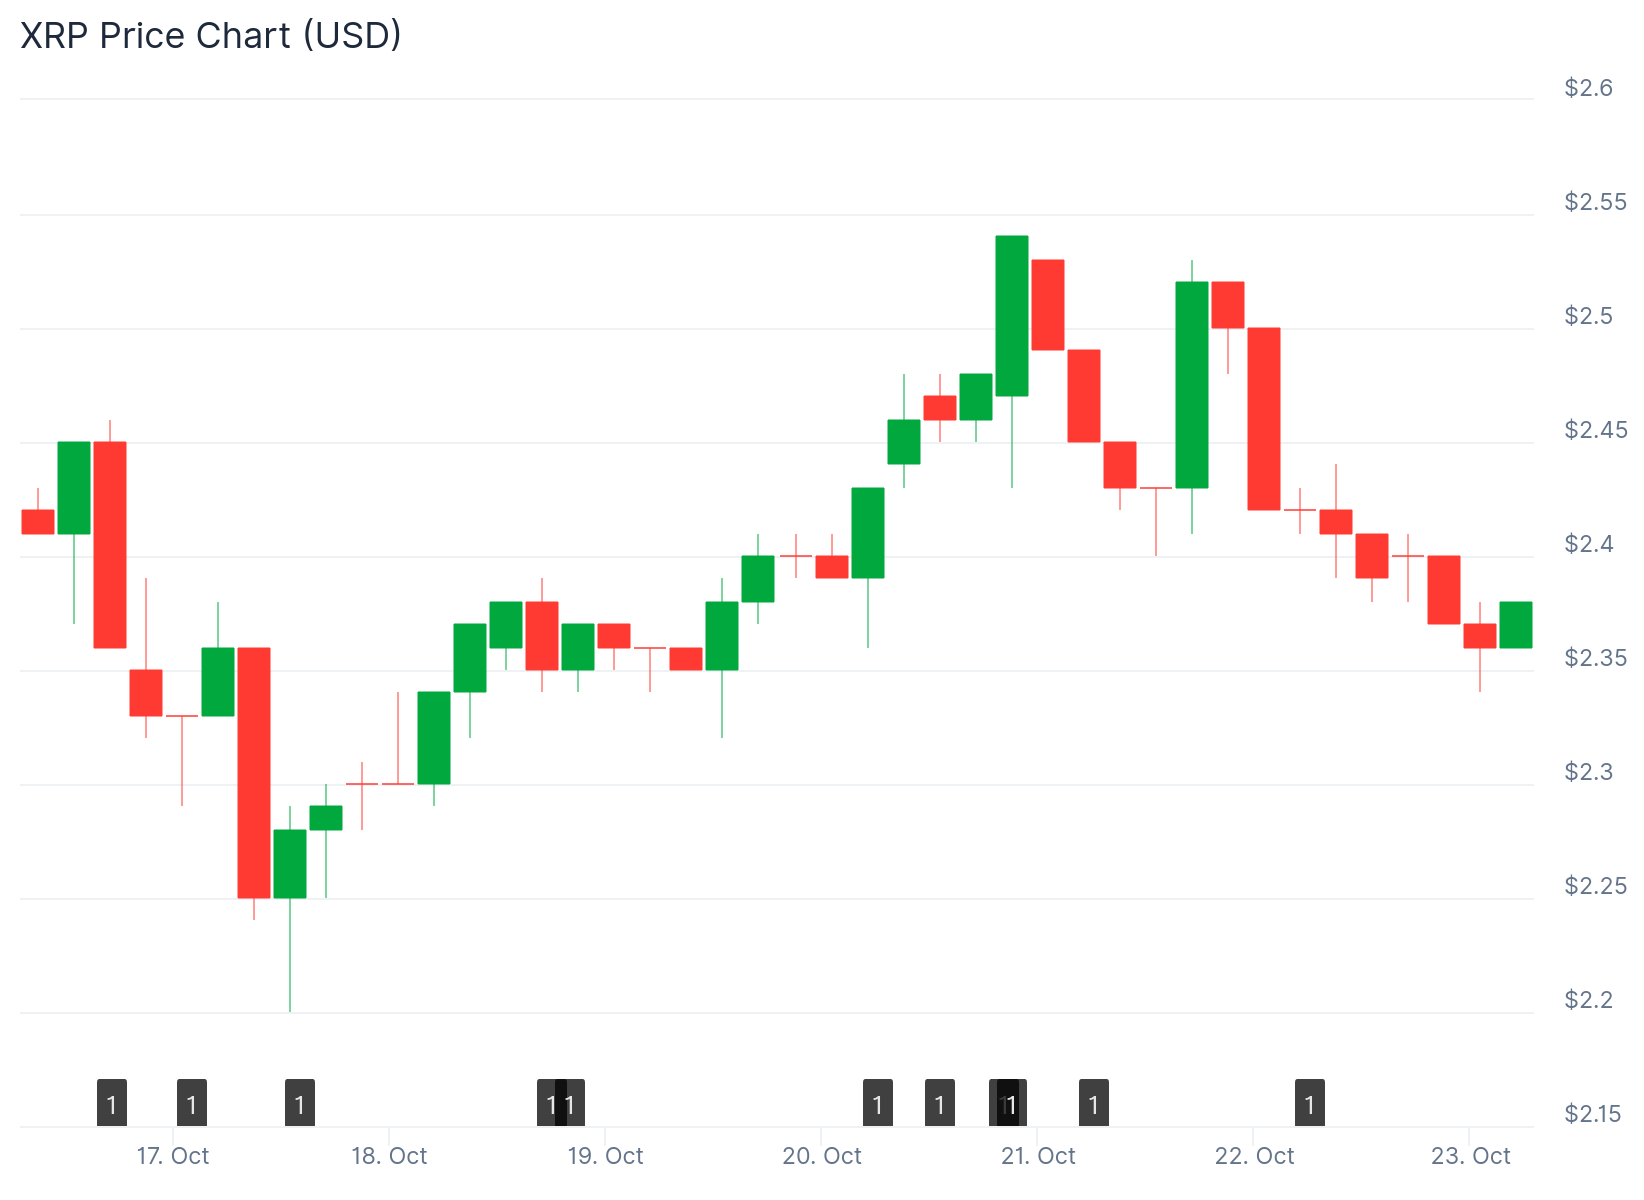
The token currently sits below all its moving averages. Bearish momentum has persisted across recent trading sessions as the broader cryptocurrency market experiences downward pressure.
Despite recent losses, chart analysis reveals a promising formation developing on the four-hour timeframe. An inverse head-and-shoulders pattern is taking shape in the price action.
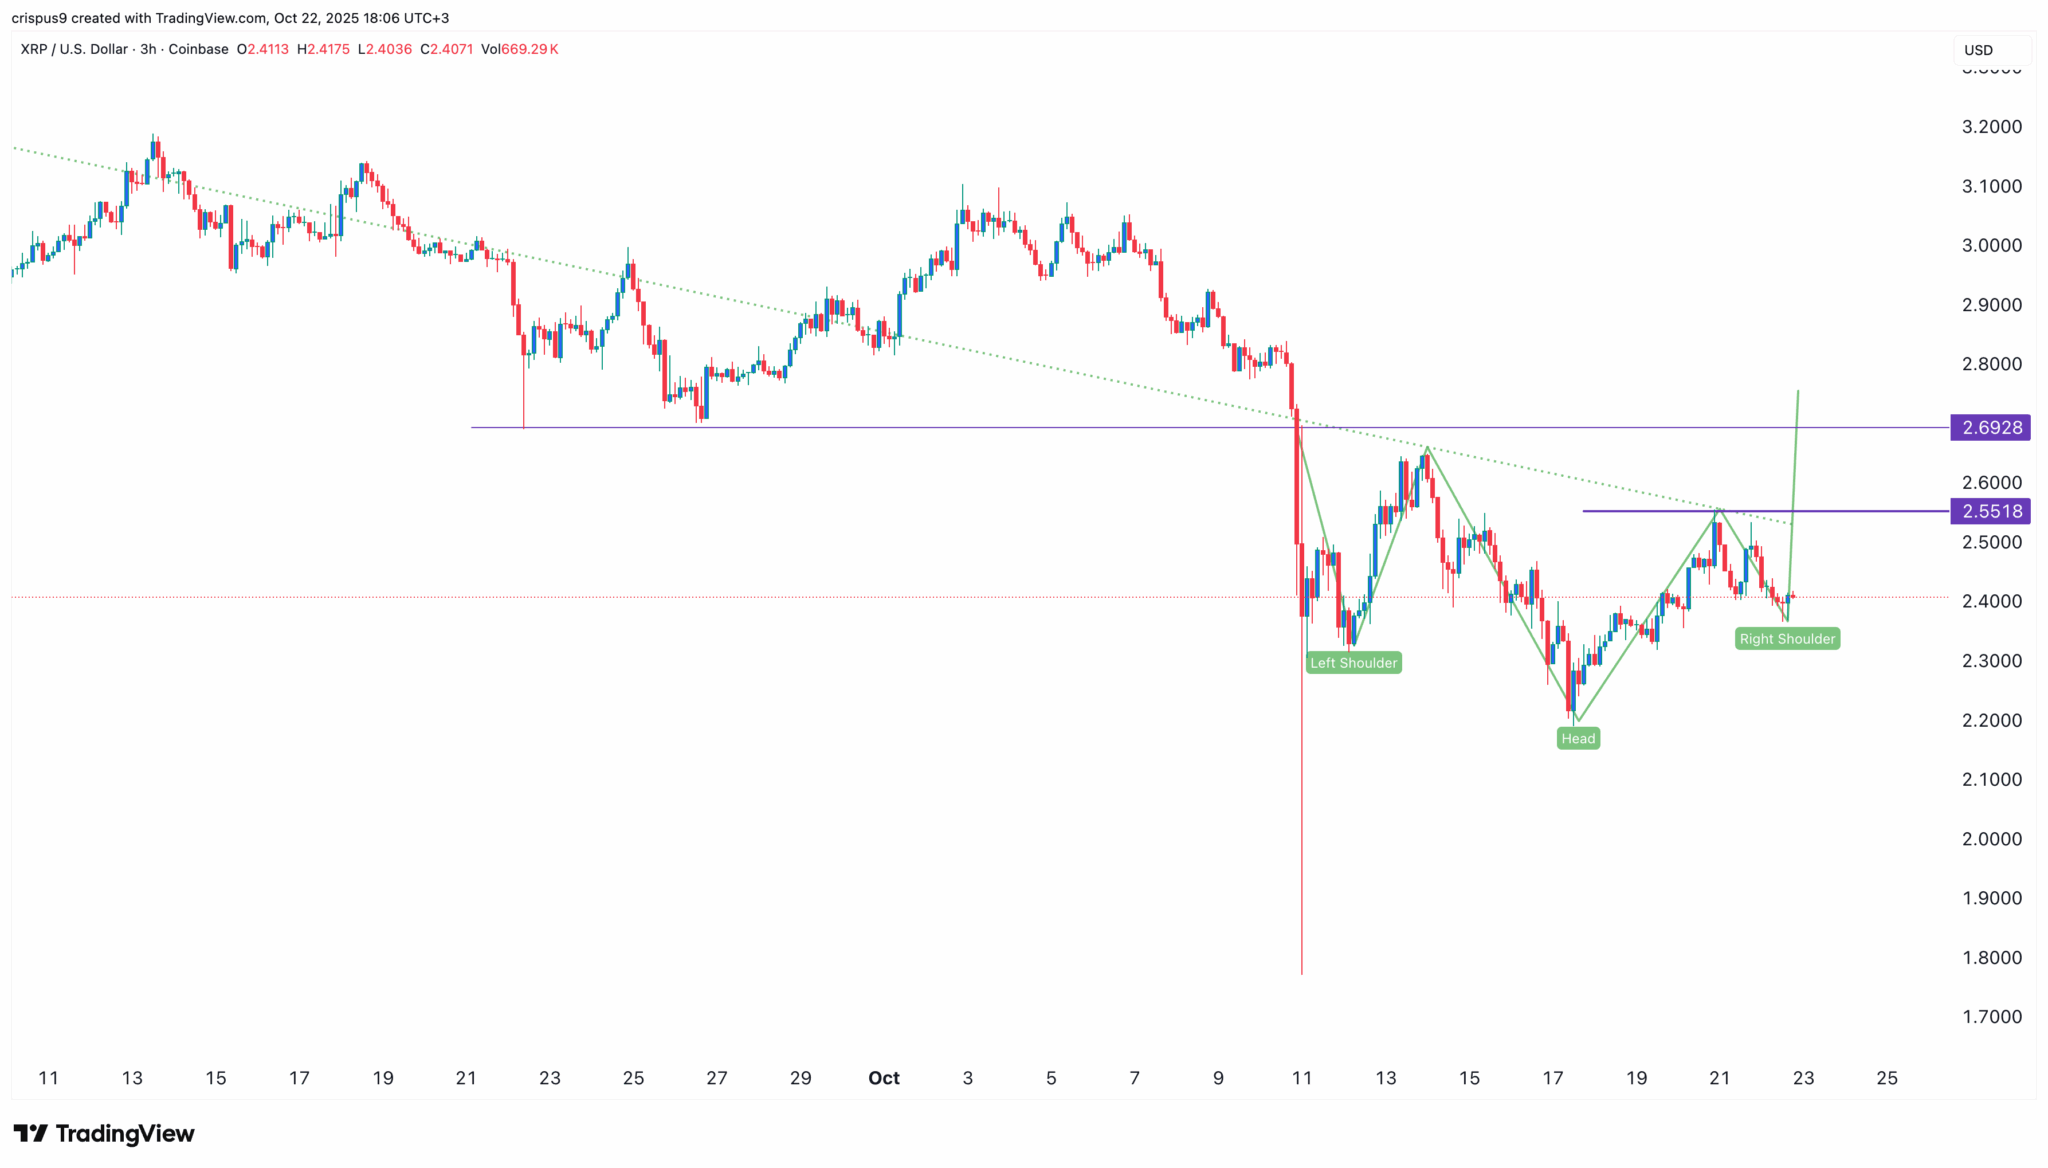
This technical formation features three distinct components. The head marks the lowest point at $2.20.
The left shoulder established itself at $2.32. The right shoulder is currently forming as traders monitor price developments.
A slanted neckline connects the peak swings dating back to October 13. This line represents a crucial resistance barrier for any upward breakout attempt.

Growing Institutional Interest
The REX-Osprey XRP ETF has reached a major achievement by crossing the $100 million asset threshold. The fund began trading on September 18 and has experienced consistent growth.
Trading data shows the ETF has registered positive inflows every day since its debut. These inflows persisted even as the cryptocurrency market faced selling pressure.
The steady institutional demand highlights continued appetite for XRP investment products. This performance could indicate strong interest when additional spot XRP ETFs receive regulatory approval.
Both Franklin Templeton and Bitwise have filed applications for their own spot XRP exchange-traded funds. These products are currently under review by the Securities and Exchange Commission.
Stablecoin Expansion
Ripple’s RLUSD stablecoin now holds $874 million in total value. The asset is nearing the important $1 billion benchmark.
This expansion demonstrates growing engagement with the XRP Ledger ecosystem. Increased stablecoin usage generally correlates with higher network activity and transaction counts.
Price Targets and Technical Outlook
If XRP successfully breaks through the neckline resistance, the next target sits at $2.55. This price point corresponds to the October 20 high.
Breaking above $2.55 would establish a pathway toward $2.69. This target aligns with the September 22 low.
Conversely, dropping below the left shoulder support at $2.32 would invalidate the bullish pattern. Such a breakdown could drive prices toward the head level at $2.18.
The 100-hourly Simple Moving Average currently provides overhead resistance. The MACD indicator reflects bearish momentum, while the RSI trades below 50.
Primary support levels are positioned at $2.32 and $2.27. Main resistance zones exist at $2.42 and $2.50.
A recent breakdown occurred below a rising trend line that provided support at $2.32. This technical break added to the downward pressure on the hourly chart.
During a recent recovery effort, buyers managed to push prices above $2.50 from a $2.25 base. However, sellers emerged near $2.55 and forced the price lower.
The XRPR ETF has gathered $100 million in assets in slightly over one month of operations.
Get 3 Free Stock Ebooks
Discover top-performing stocks in AI, Crypto, and Technology with expert analysis.
- Top 10 AI Stocks - Leading AI companies
- Top 10 Crypto Stocks - Blockchain leaders
- Top 10 Tech Stocks - Tech giants

