

TLDR
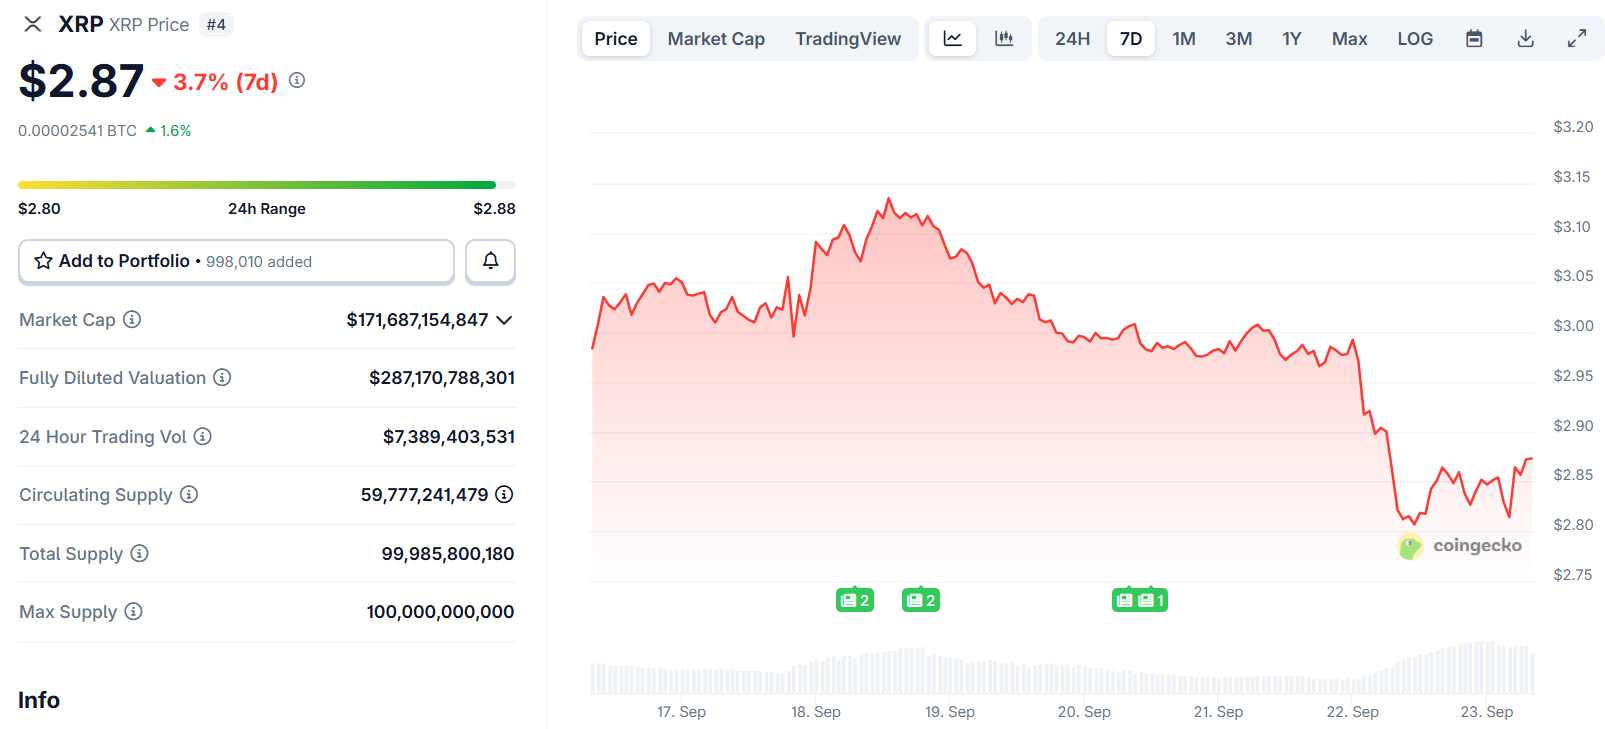
- XRP declined 5% to $2.80 after failing to hold $3 support level
- Descending triangle pattern suggests potential drop to $2.07 target
- Technical indicators show bearish momentum with RSI at 39
- NUPL data indicates possible local top formation at $3.18
- Long-term analysts maintain bullish outlook despite near-term weakness
XRP price action has turned bearish after the cryptocurrency failed to maintain crucial support above $3. The digital asset dropped 5% in 24 hours, currently trading around $2.80 as selling pressure intensifies.
The decline represents a continuation of weakness that began when XRP rejected higher levels near $3.120. Bears successfully pushed the price through multiple support zones including $3.00 and $2.920.
XRP reached an intraday low near $2.678 before attempting a modest recovery. The cryptocurrency now trades below the 100-hourly Simple Moving Average and faces resistance from a bearish trend line at $2.920.
Current market structure shows XRP positioned below key technical levels that previously provided support. The break below $3 has shifted the immediate outlook from bullish to bearish across shorter timeframes.
Technical Pattern Signals Further Downside
Daily chart analysis reveals a descending triangle formation developing over recent trading sessions. This bearish continuation pattern features declining resistance and horizontal support around $2.75.
The pattern’s technical target sits near $2.07, calculated by measuring the triangle’s height and projecting from the anticipated breakout point. This represents approximately 26% downside from current levels.

XRP currently trades beneath both 50-day and 100-day Simple Moving Averages, confirming the bearish technical bias. The Relative Strength Index has declined from 50 to 39, indicating accelerating downward momentum.
Key support levels include $2.820 and $2.80 on the downside. A decisive break below $2.80 could open the path toward $2.740 and subsequently $2.650.
The 200-day Simple Moving Average at $2.52 may provide technical support if the correction deepens. This level represents a potential area where buyers might emerge.
Net Unrealized Profit/Loss metrics show concerning signals for XRP’s near-term trajectory. The indicator currently sits in the 0.5-0.6 zone, historically associated with local price peaks.

With over 94% of XRP supply showing unrealized profits, increased selling pressure remains a possibility. Similar configurations in previous cycles preceded sharp price corrections.
XRP Price Prediction
Despite bearish technical signals dominating shorter timeframes, some analysts maintain constructive longer-term views for XRP. Weekly chart patterns suggest the broader uptrend structure remains intact.
The descending triangle pattern requires a close below $2.75 support to activate the $2.07 target. Until this occurs, XRP could attempt to reclaim higher levels.
Resistance on any recovery attempt includes $2.90 and $2.920. A clear break above these levels might target the $3.00 zone where previous support turned resistance.
Hourly technical indicators including MACD show momentum weakening in bearish territory. This supports the expectation for continued near-term pressure on XRP price.
The cryptocurrency faces a critical test at current support levels. A break below $2.75 would confirm the descending triangle pattern and likely accelerate selling toward the calculated target zone near $2.
Get 3 Free Stock Ebooks
Discover top-performing stocks in AI, Crypto, and Technology with expert analysis.
- Top 10 AI Stocks - Leading AI companies
- Top 10 Crypto Stocks - Blockchain leaders
- Top 10 Tech Stocks - Tech giants

