

TLDR
- XRP experienced a dramatic 15-minute crash on August 14, dropping from $3.21 to $3.00 and wiping out leveraged positions worth $420 million across the crypto market
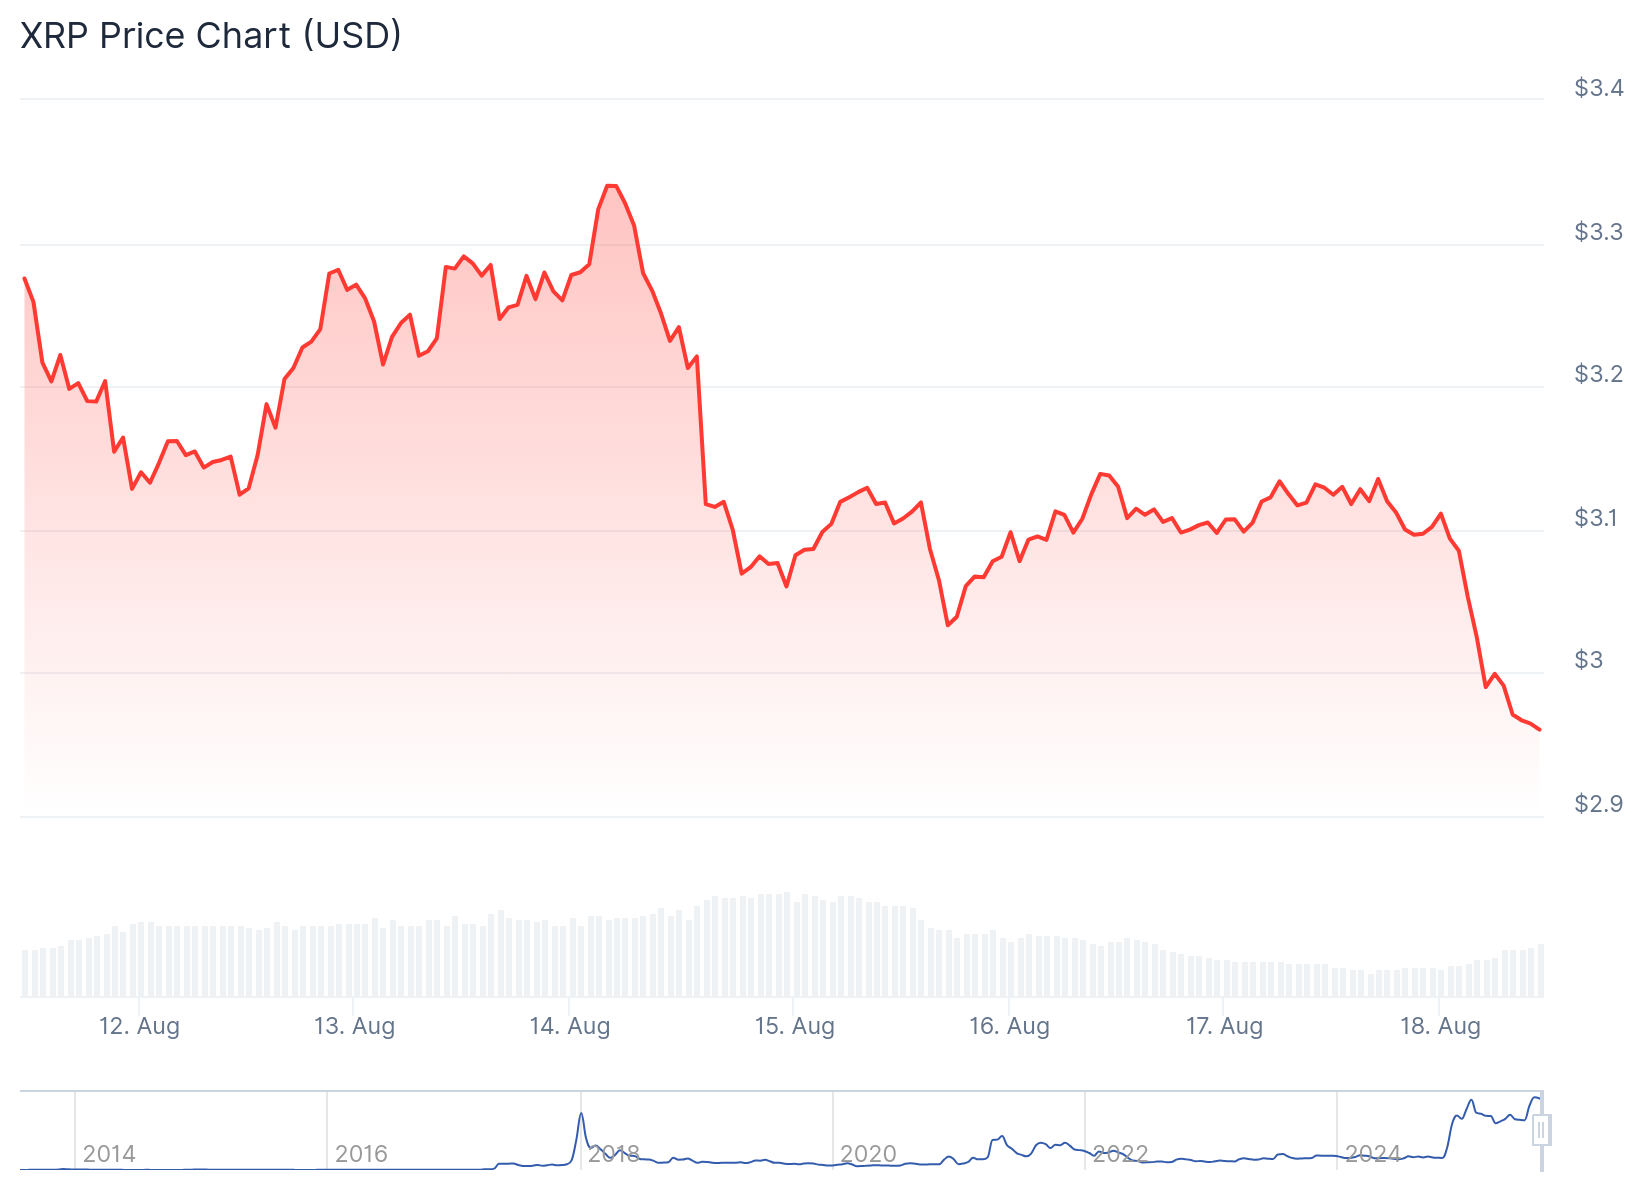
- The token has since bounced back and is currently consolidating around $3.06, but faces resistance at multiple levels including $3.15 and bearish technical signals
- Market experts believe the sudden drop was likely a liquidity grab rather than a fundamental breakdown, as XRP held crucial support zones
XRP suffered a brutal selloff that erased millions in trader positions. The cryptocurrency has since found stability but remains vulnerable to further volatility.
Market chaos erupted on August 14 when XRP crashed over 7% within a mere 15-minute timeframe. The violent price action sent shockwaves through trading platforms as the token plummeted from $3.21 to precisely $3.00.
This sudden collapse contributed to an unprecedented $420 million liquidation event across the cryptocurrency sector. Leveraged traders were caught completely off guard as stop losses triggered in rapid succession.
The speed and severity of the decline raised questions about potential market manipulation. Many traders who had positioned for continued upside found their accounts wiped clean in minutes.
Despite the initial panic, XRP managed to find its footing at the psychologically important $3.00 threshold. The rapid stabilization at this level suggested underlying buying interest remained strong.
Market observers noted that XRP respected key Fibonacci retracement levels during the selloff. The token bounced from the 0.382 retracement at $3.00 rather than breaking the more critical 0.5 level at $2.76.

This price behavior led analysts to theorize that the crash was engineered rather than organic. Large players may have orchestrated the move to hunt stop losses and accumulate positions at better prices.
Technical Analysis Reveals Mixed Signals
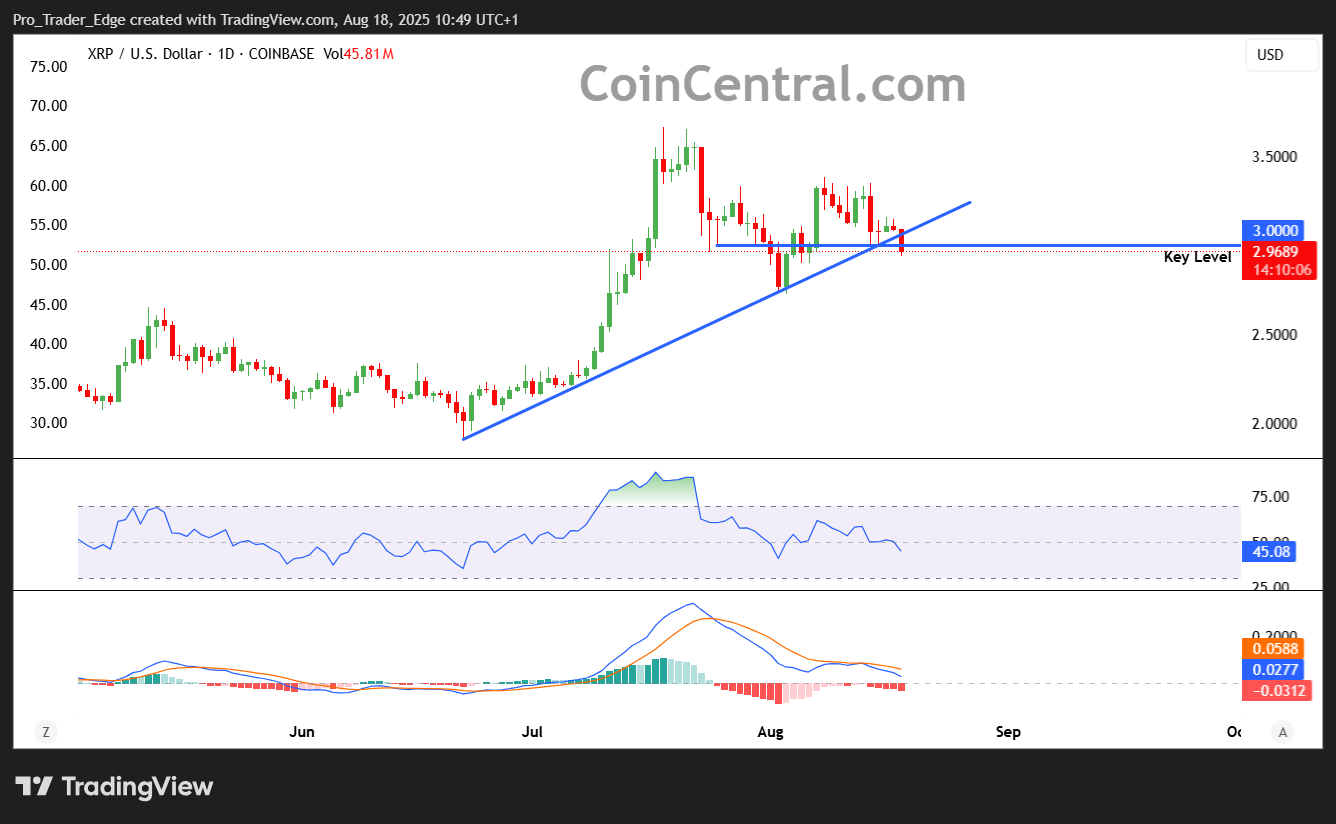
Current price action shows XRP trading near $3.06 as bulls attempt to regain control. However, several technical indicators are flashing warning signs for the near term.
The cryptocurrency is struggling to reclaim the $3.15 resistance zone that previously acted as support. Multiple failed attempts to break higher have left traders questioning the strength of the recovery.
Bearish momentum is building across shorter timeframes with the MACD indicator turning negative. The RSI has also dropped below the neutral 50 level, confirming selling pressure remains elevated.
XRP is currently trading beneath both its 100-hour moving average and the $3.12 pivot level. A descending trend line has formed around $3.06, creating additional overhead resistance.
The recent low at $2.97 represents the floor of the current correction from highs near $3.35. Any break below this level could trigger another wave of algorithmic selling.
Immediate resistance levels are clearly defined at $3.02, $3.05, and $3.06 based on recent price rejections. Bulls need to clear these barriers to regain upside momentum.
Support Structure Remains Critical
The $3.11 golden retracement level has emerged as a crucial battleground for determining XRP’s next direction. This area provided strong support during the initial recovery and continues to attract buyers.
Below current levels, the $2.96 zone represents the first major support based on recent lows. A failure here would likely test the $2.92 level where stronger buying interest may emerge.
The $2.85 area serves as the next line of defense should selling pressure intensify. This level aligns with previous consolidation zones and could provide a temporary floor.
Most importantly, the $2.76 macro support remains the key level for maintaining the broader bullish structure. This represents the 0.5 Fibonacci retracement of the entire recent rally.
As long as XRP holds above $2.76, the long-term uptrend remains intact with targets still pointing toward $4.70. Breaking this support would likely trigger a deeper retracement back toward $2.00.
The current consolidation phase may continue as traders digest the recent volatility and await clearer directional signals from the market.
Get 3 Free Stock Ebooks
Discover top-performing stocks in AI, Crypto, and Technology with expert analysis.
- Top 10 AI Stocks - Leading AI companies
- Top 10 Crypto Stocks - Blockchain leaders
- Top 10 Tech Stocks - Tech giants

