

TLDR
- XRP price drops 1.78% to $2.78 amid broader crypto market fear
- Network activity crashes with active addresses falling 60% since July
- Futures open interest declines from $10.94B to $7.7B showing weak conviction
- Technical analysis reveals descending triangle with $2.70 critical support
- Break below $2.70 could trigger 25% decline to $2 target level
XRP price continues its downward trajectory, trading at $2.78 after declining 1.78% in the past 24 hours. The cryptocurrency has struggled to maintain momentum since reaching multi-year highs above $3.60 in July.
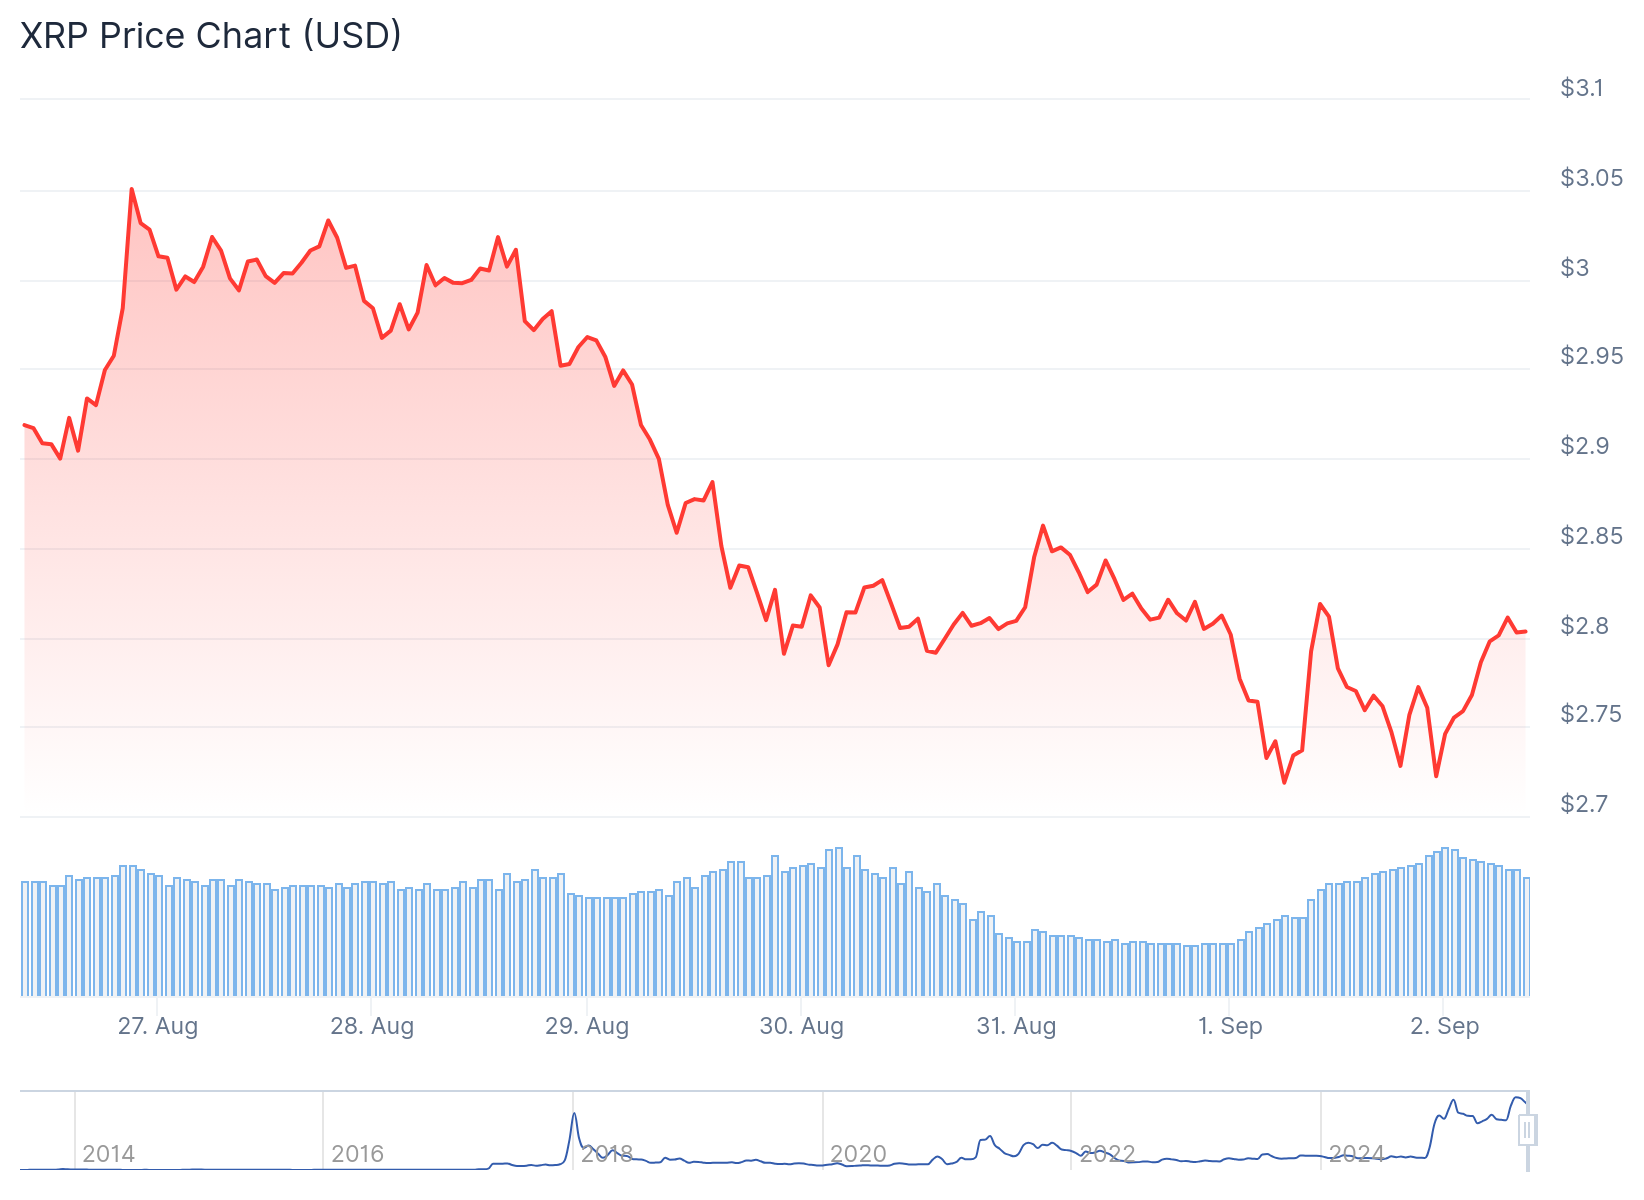
Market sentiment has deteriorated across the crypto space. The Fear & Greed Index has dropped to 46, moving from neutral territory into fear zone. This shift reflects growing investor caution as risk-off sentiment dominates trading decisions.
Network Activity Shows Sharp Decline
On-chain data reveals troubling trends for XRP’s ecosystem. Active addresses on the XRP Ledger have plummeted to just 19,250 on Monday. This represents a massive 60% decline from the 50,000 active addresses recorded during July’s peak.

The Active Addresses metric tracks wallets actively sending or receiving XRP transactions. Such a dramatic reduction indicates weakening user engagement and reduced confidence among network participants.
Futures market data confirms the bearish sentiment. Open interest has contracted from $10.94 billion to $7.7 billion over recent weeks. Declining open interest typically signals reduced institutional and retail conviction in the asset’s near-term prospects.
Technical Analysis Points to Critical Juncture
XRP’s price action has formed a descending triangle pattern since July’s rally. This bearish formation features horizontal support at $2.70 and a downward-sloping resistance trendline.


The descending triangle often signals continuation of the prevailing downtrend. Pattern completion typically occurs when price breaks below the horizontal support level.
Bulls are currently defending the $2.70 support zone. Success here could trigger a relief rally toward $3.09, where the 50-day moving average and 0.618 Fibonacci retracement level converge.
However, failure to hold $2.70 would likely accelerate selling pressure. The next support zone lies between $2.60 and $2.48, corresponding to the 100-day and 200-day moving averages.
A breakdown below this demand zone targets the $2.08 level, representing a potential 25% decline from current prices.
Short-term indicators present mixed signals. The hourly RSI remains above 50, suggesting oversold conditions may be easing. However, the MACD continues losing momentum in bearish territory.
XRP Price Prediction
Looking ahead, XRP faces a critical test at the $2.70 support level. Multiple technical and fundamental factors suggest increased downside risk in the near term.
The combination of declining network activity, reduced futures interest, and bearish chart patterns creates headwinds for recovery attempts. September’s historically weak performance for cryptocurrencies adds additional pressure.
However, strong buyer clusters appear around $2.70 according to liquidation heatmaps. This could provide temporary support and trigger a relief bounce if broader market conditions improve.
For sustained recovery, XRP must reclaim the $2.85 resistance level and break above the descending trendline near $3.09.
Get 3 Free Stock Ebooks
Discover top-performing stocks in AI, Crypto, and Technology with expert analysis.
- Top 10 AI Stocks - Leading AI companies
- Top 10 Crypto Stocks - Blockchain leaders
- Top 10 Tech Stocks - Tech giants

