

TLDR
- XRP price dropped below $3 psychological support, currently trading near $2.97 after 5% daily decline
- Technical patterns show symmetrical triangle breakdown with $2.25 measured target representing 25% correction
- Volume analysis indicates persistent selling pressure since cryptocurrency peaked at $3.66 in July
- Multiple support zones at risk including 50-day SMA at $2.94 and key levels around $2.60-$2.45
- Momentum indicators like RSI show bearish divergence as buyers lose control of price action
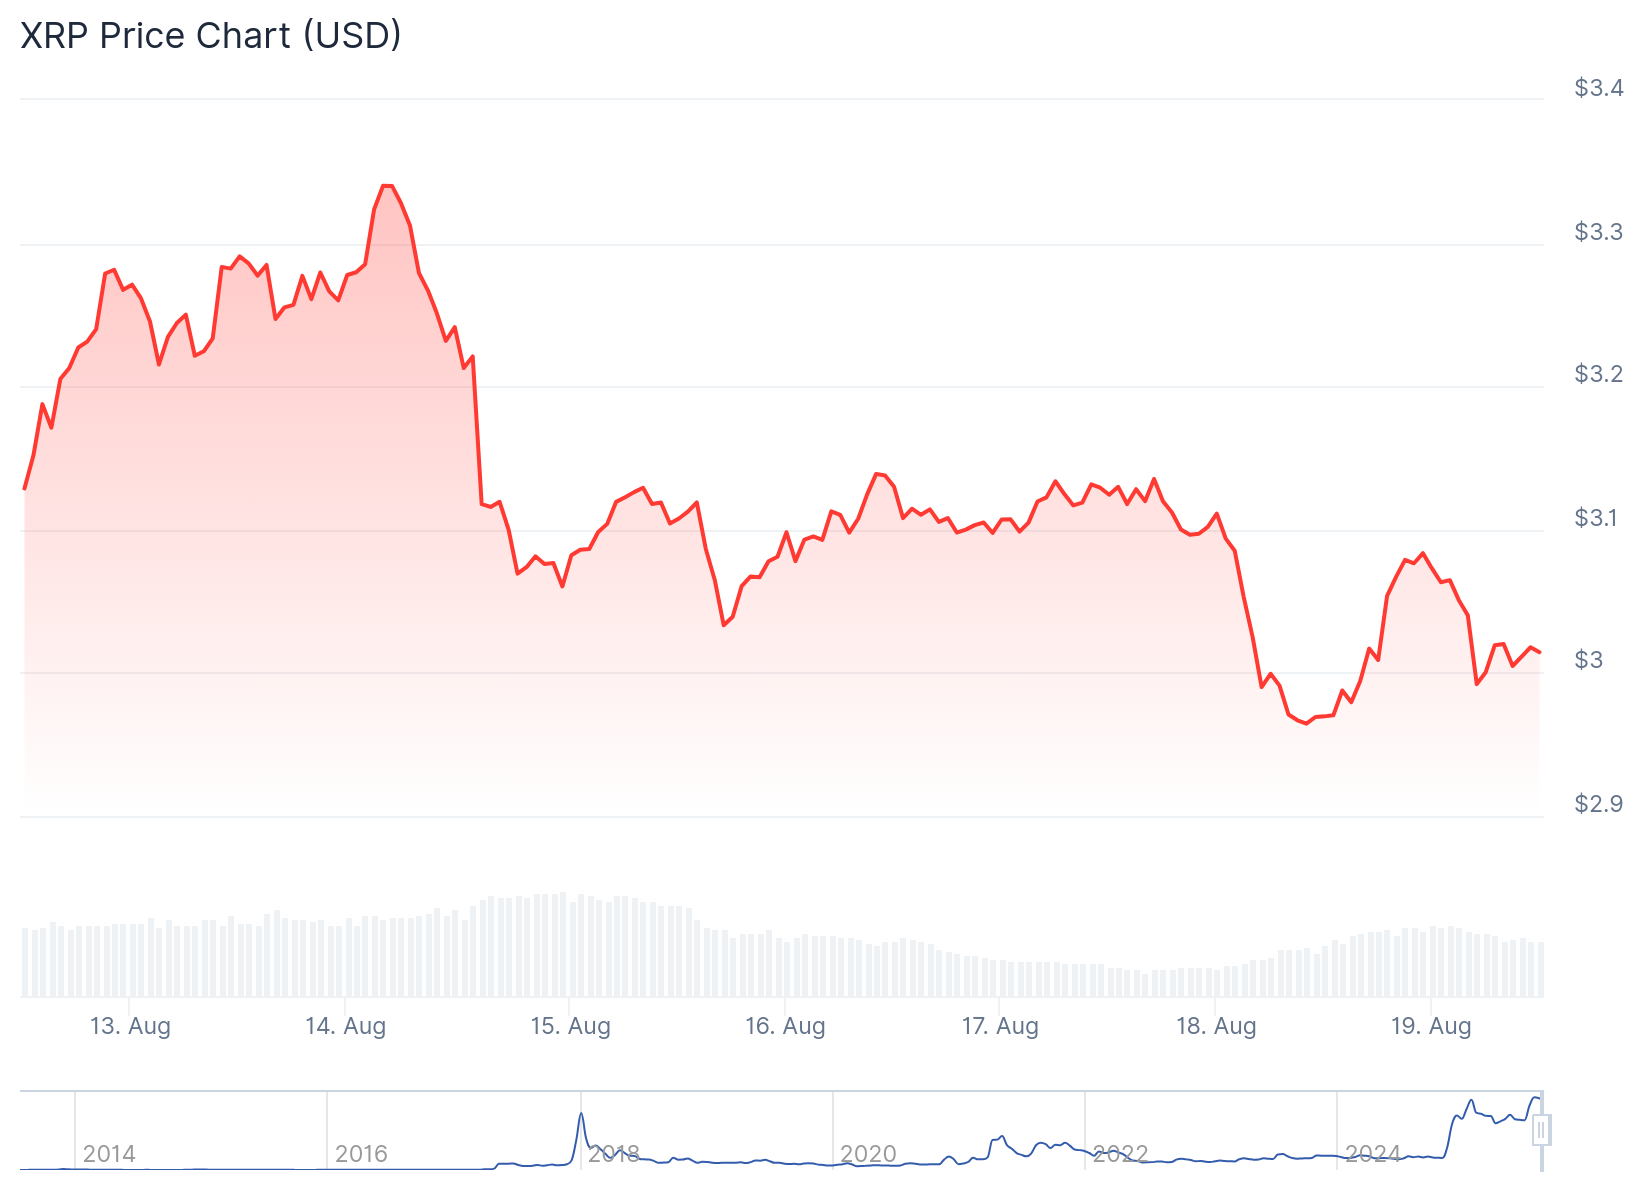
XRP cryptocurrency trading shows increasing bearish pressure as the token struggles below the critical $3 psychological support level. The digital asset experienced a 5% decline over the past 24 hours, bringing the current XRP price to approximately $2.97.
This latest XRP price movement represents a breakdown of a key technical level that has provided support in recent weeks. Market analysis reveals this could signal the beginning of a more extended correction phase for the cryptocurrency.
XRP price charts display a symmetrical triangle pattern that has now been breached to the downside. Technical analysis of this formation suggests a measured move target of $2.25. This projection would represent approximately 25% downside from current XRP price levels.

The breakdown comes after XRP reached multi-year highs of $3.66 on July 18. Since that peak, selling pressure has mounted steadily across spot markets.
Historical context provides additional concern for XRP price bulls. The last time the cryptocurrency closed below $3 with elevated volume occurred in January. That breakdown preceded a steep 50% correction that brought XRP price down to $1.61 by April.
Market momentum indicators support the bearish XRP price outlook. The Relative Strength Index has declined from 61 to 45 over the past week. This deterioration suggests bulls are losing control of near-term price direction.

XRP Price Support Levels Under Pressure
Multiple technical support zones now come into focus for XRP price action. The first critical area lies between the 50-day simple moving average at $2.94 and the local swing low at $2.72. This zone was previously tested on August 2.
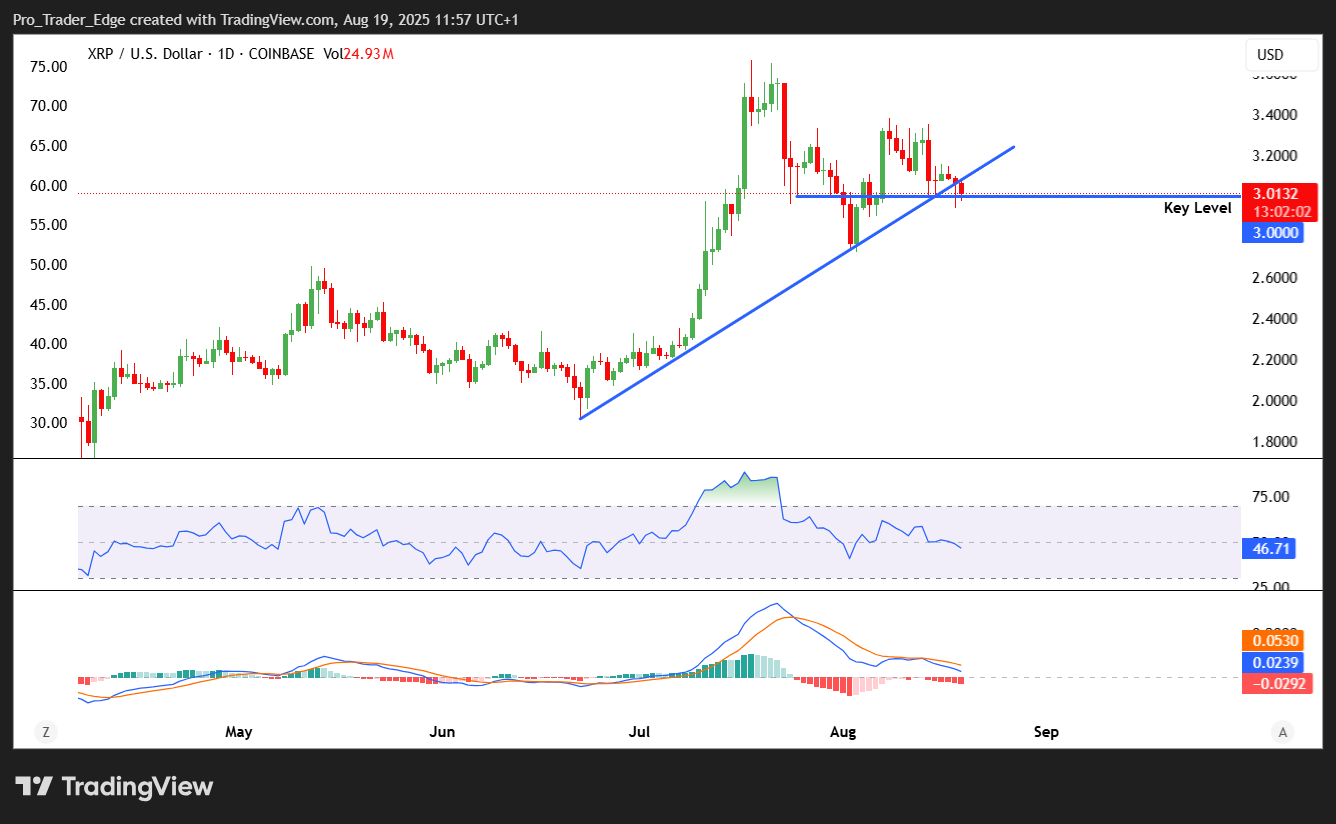
Should XRP price break through this initial support cluster, the next major area sits between $2.60 and $2.45. These levels correspond to the 100-day and 200-day simple moving averages respectively.
A failure to hold these longer-term moving averages would bring the $2.24 level into play. This price point marks where XRP began its July rally that eventually reached the $3.66 highs.
Shorter-term XRP price analysis reveals additional technical weakness. On hourly charts, the cryptocurrency trades below both the $3.05 level and the 100-hour simple moving average.
A bearish trend line has formed on the hourly timeframe with resistance currently positioned at $3.070. This technical level has rejected multiple recovery attempts since the initial breakdown.
XRP Price Prediction
Spot trading volume analysis provides insight into the underlying XRP price dynamics. The 90-day spot taker cumulative volume delta has turned negative, indicating sell orders have dominated buy orders.

This bearish volume trend began on July 28, roughly 10 days after XRP reached its multi-year high. Negative CVD readings typically indicate profit-taking behavior among traders and investors.
When CVD remains in negative territory, it suggests sellers are not backing down from their positions. This persistence often sets the stage for continued price declines, as observed in previous XRP corrections.
Current data shows 94% of XRP supply remains in profit at present price levels. This metric has historically coincided with local tops in previous market cycles.
Recovery attempts have faced consistent resistance at key Fibonacci retracement levels. XRP price struggled near the 76.4% retracement of its recent decline, failing to establish sustainable buying interest.
The MACD indicator on hourly charts shows accelerating bearish momentum. This technical oscillator suggests selling pressure may continue in the near term.
XRP price faces immediate resistance at $3.0450 for any recovery attempts. Above this level, the cryptocurrency would need to clear $3.070 to challenge the bearish trend line formation.
Major support levels for XRP price include $2.940 and $2.880 on the downside. A break below these zones could accelerate the decline toward the $2.25 target area identified by the triangle breakdown pattern.
Get 3 Free Stock Ebooks
Discover top-performing stocks in AI, Crypto, and Technology with expert analysis.
- Top 10 AI Stocks - Leading AI companies
- Top 10 Crypto Stocks - Blockchain leaders
- Top 10 Tech Stocks - Tech giants

