

TLDR
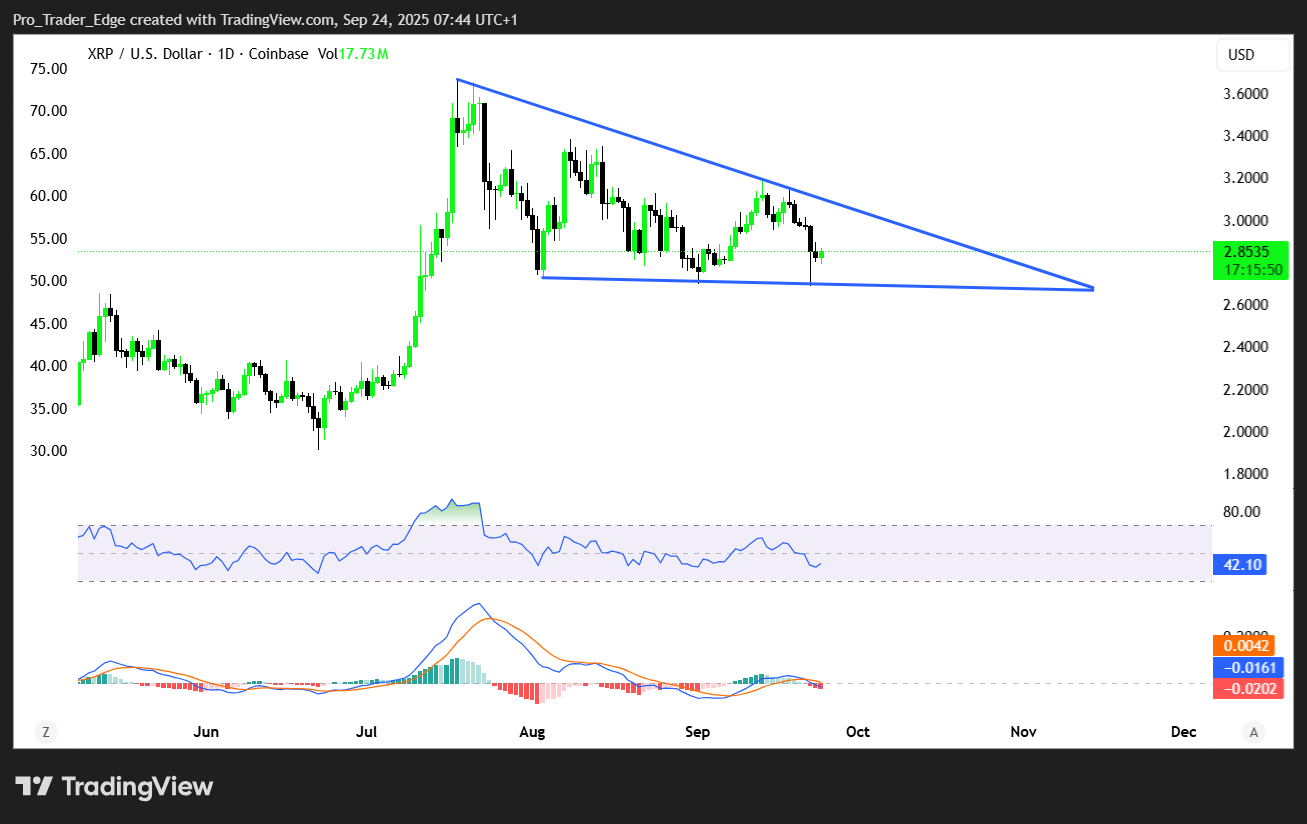
- XRP trades at $2.88 within symmetrical triangle formation with breakout pending
- Bulls defend $2.70-$2.80 support zone while bears target moves below $2.778
- Triangle completion could trigger rally to $4.20 or decline to $2.65 levels
- Technical indicators show mixed signals as price approaches critical decision point
- Institutional adoption and cross-border payments drive long-term bullish outlook
XRP price prediction models suggest the cryptocurrency faces a pivotal moment as it trades near $2.88. The token has formed a symmetrical triangle pattern over recent weeks that could determine the next major price direction.
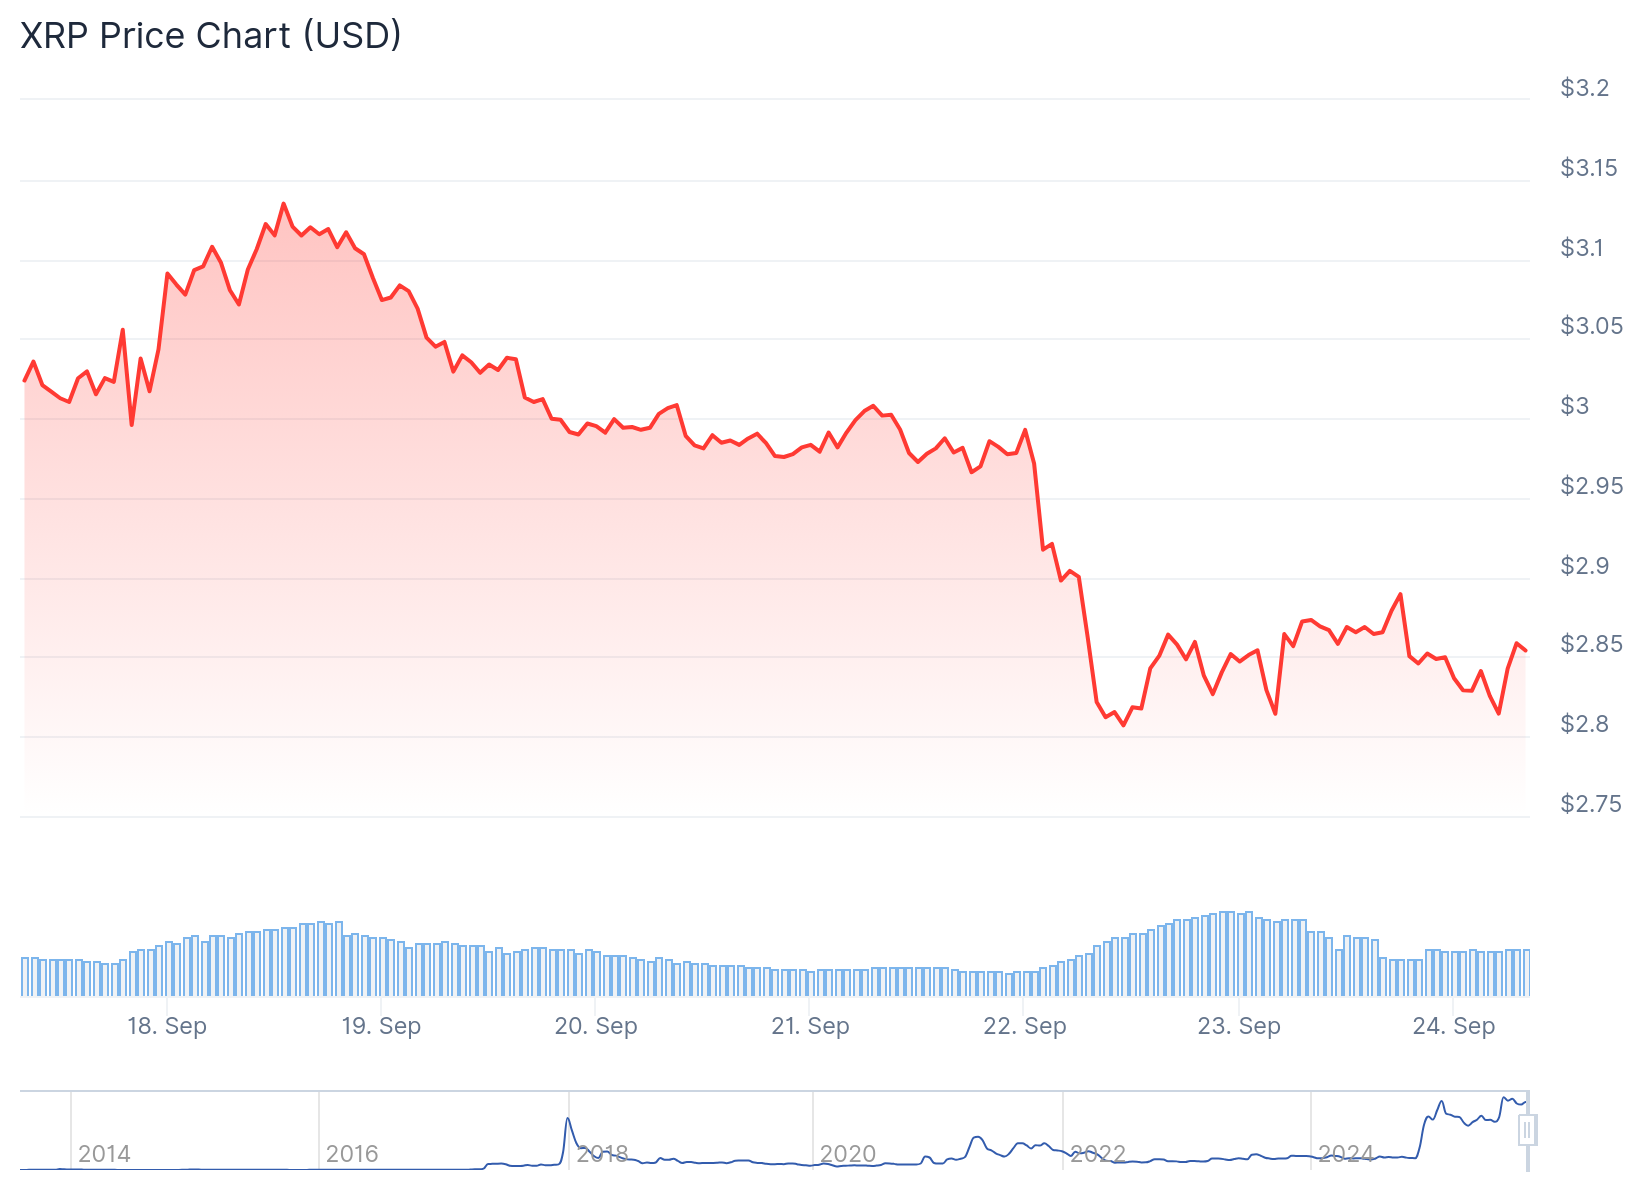
Technical analysis reveals strong buyer interest around the $2.70-$2.80 support zone. This area has provided a foundation for potential upward moves in previous trading sessions.
Recent price action shows XRP declined below the $2.90 level after failing to maintain support. Bears pushed the token to a low near $2.678 before bulls attempted a recovery.
The cryptocurrency now trades below its 100-hourly Simple Moving Average at $2.90. A bearish trend line has emerged with resistance positioned at this same $2.90 level.
Technical Levels Signal Key Price Targets
Chart analysis indicates the symmetrical triangle formation could generate explosive price movements in either direction. If XRP breaks above resistance, the first target sits at $3.50 based on technical projections.
The primary bullish target reaches $4.20 using the triangle’s measured move calculation. This level represents the completion of the pattern’s upside potential.

Resistance levels begin at $2.880 followed by the critical $2.90 zone. A clear move above $2.90 could propel XRP toward $2.950 and eventually the $3.00 psychological level.
The next major hurdle for bulls appears near $3.120 if upward momentum continues. This level aligns with previous resistance zones from earlier price action.
Downside Risks Target Lower Support Zones
XRP price prediction models also account for potential declines if the triangle breaks lower. Initial support sits at $2.780 with the next level at $2.715.
A break below $2.715 could accelerate selling toward $2.650. The hourly MACD indicator shows increasing bearish momentum while RSI dropped below 50.
Volume analysis suggests continued selling pressure since recent highs. Technical indicators point to further weakness if key support levels fail to hold.
Institutional factors provide long-term support through Ripple’s central bank digital currency partnerships. Cross-border payment solutions continue expanding the token’s use cases.
On-chain metrics show improving transaction volumes that support bullish price predictions. The broader cryptocurrency market sentiment could influence XRP’s breakout direction.
XRP Price Prediction
Short-term XRP price prediction targets depend on the triangle breakout direction. Bullish scenarios target $3.50 initially with $4.20 as the ultimate goal.
Bearish price predictions point to $2.65 if support breaks. The token’s institutional backing provides long-term upside potential regardless of near-term volatility.
Get 3 Free Stock Ebooks
Discover top-performing stocks in AI, Crypto, and Technology with expert analysis.
- Top 10 AI Stocks - Leading AI companies
- Top 10 Crypto Stocks - Blockchain leaders
- Top 10 Tech Stocks - Tech giants

