

TLDR
- XRP trades at $2.86 after 14% decline, testing critical $2.75 support level
- Symmetrical triangle pattern suggests 30% rally potential to $3.62 if resistance breaks
- October historically weak for XRP with average -4.58% monthly returns
- ETF approval decisions expected October 18-25 could trigger institutional inflows
- Key resistance at $2.88 must break for continued upward momentum
XRP price attempts recovery from recent lows as the cryptocurrency tests critical technical levels. Trading near $2.86, XRP faces multiple resistance barriers while bulls defend key support zones.
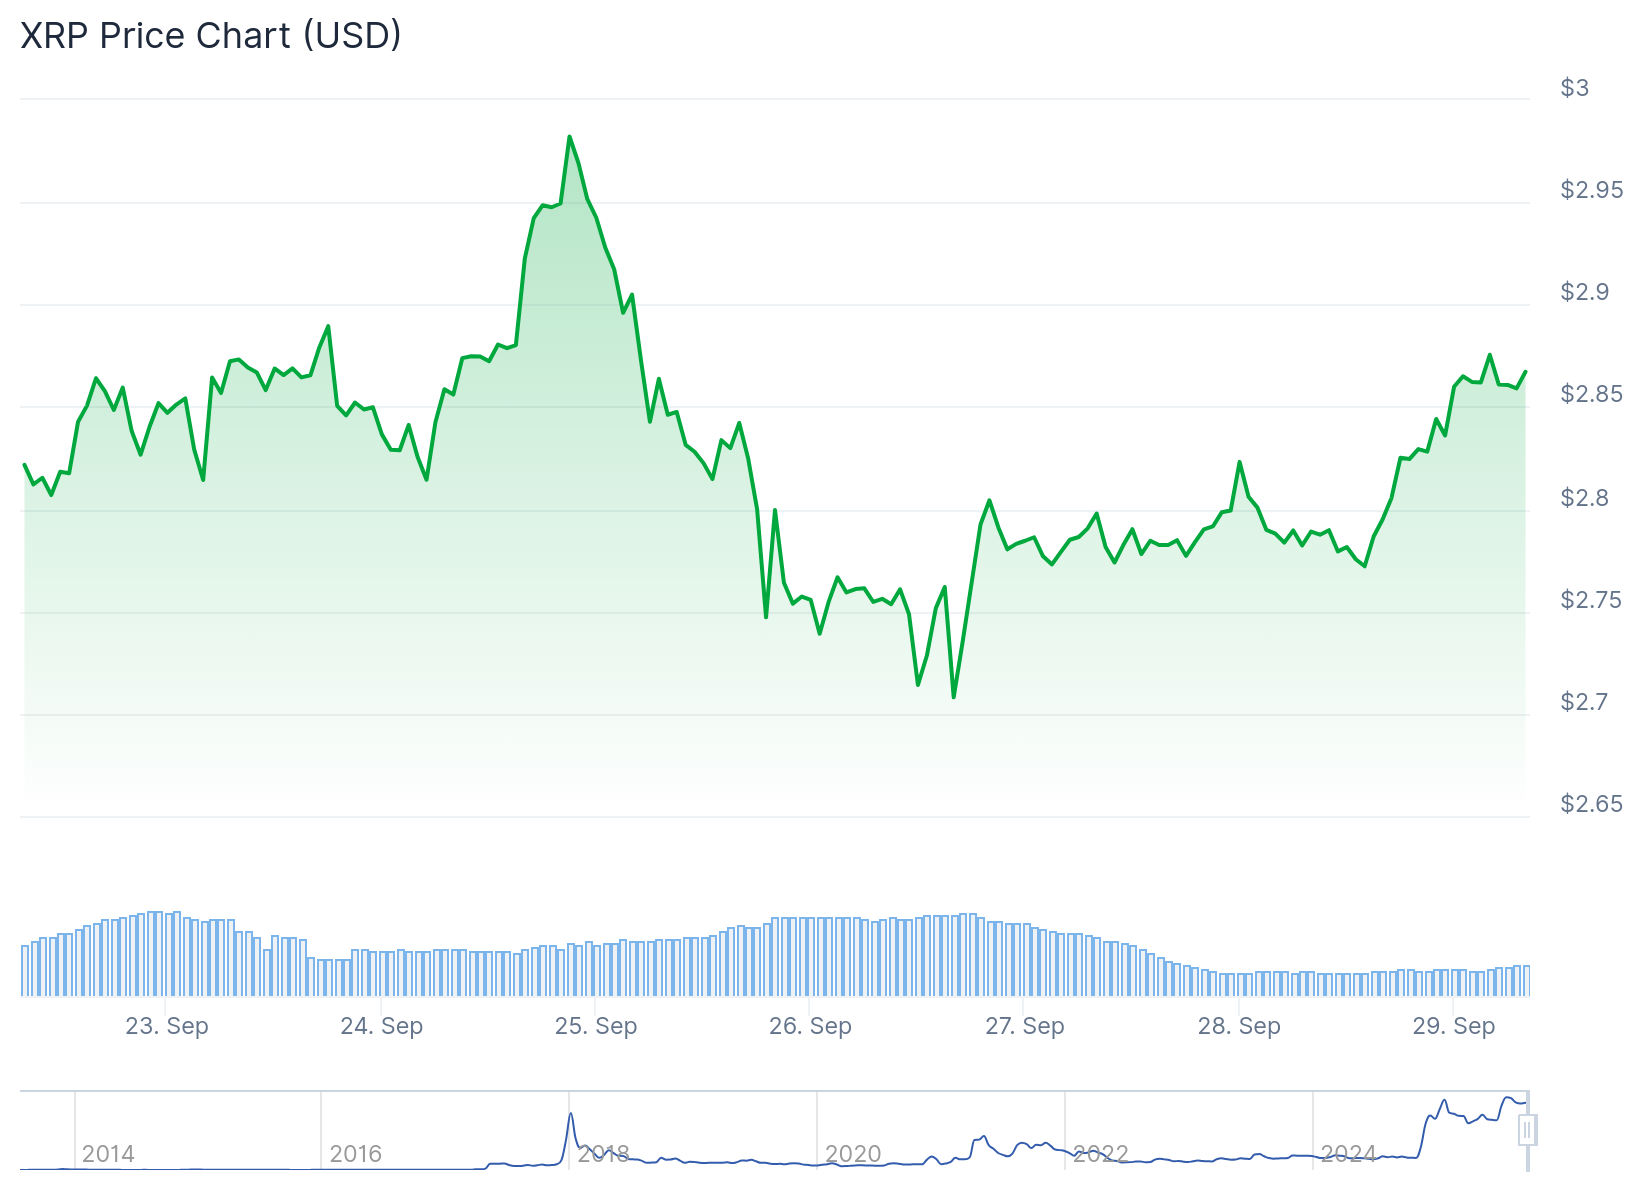
The digital asset dropped 14% over two weeks before finding support around $2.70. This decline brought XRP to the monthly open level of $2.77, sparking hopes for potential recovery.
Technical analysis reveals XRP successfully cleared the 50% Fibonacci retracement level from its $2.995 swing high to $2.70 low. The price now trades above the $2.820 level and 100-hourly Simple Moving Average.
A connecting bullish trend line provides support at $2.80 on hourly charts. However, immediate resistance appears near $2.88, creating the first major hurdle for continued gains.
Critical Support Zone Determines Direction
XRP faces crucial testing near the September 1 open around $2.75. This level coincides with the lower boundary of a symmetrical triangle formation on daily charts.

Maintaining price action above this trendline increases probability of breaking the descending resistance near $2.86. Such movement could target the bullish objective of $3.62, representing approximately 30% upside potential.

Glassnode distribution data shows strong demand clustering around $2.75, where nearly 1.58 billion XRP tokens were acquired. This concentration reinforces the technical importance of defending current support levels.
Supply resistance sits at $2.81, aligned with the 100-day Simple Moving Average. This barrier could limit short-term recovery attempts unless decisively broken.
Failure to hold $2.75 support might trigger selling toward $2.00, representing the bearish target of the triangle pattern. Analysts emphasize the importance of maintaining current consolidation levels.
Historical October Performance Challenges Bulls
October presents seasonal headwinds for XRP performance based on historical data. Since 2013, the cryptocurrency posted negative returns in seven of twelve October periods, averaging -4.58% monthly declines.

Despite October weakness, November typically delivers XRP’s strongest performance. The fourth quarter historically represents the best three-month period, averaging 51% gains according to Cryptorank analysis.
Recent examples include Q4 2024’s 240% rally and Q4 2023’s 20% gains. The 2017 fourth quarter proved exceptional with 1,064% returns between October and December.
Current technical indicators show mixed signals for near-term direction. The hourly MACD gains momentum in bullish territory while RSI readings hold above 50.
Major resistance levels include $2.880 and $2.920, with potential extension toward $3.020 upon clearing these barriers. Support remains at $2.80 and $2.720 for downside scenarios.
ETF Catalysts Could Drive Institutional Interest
XRP ETF approval decisions between October 18-25 represent potential catalysts for price movement. Franklin Templeton’s decision extends to November 14, while Grayscale’s determination comes October 18.
Multiple applications face deadlines during this period, with approval odds reaching 100% by December 31 according to analyst projections. First-year inflows could range $4-8 billion if approvals materialize.
Market participants note potential “sell the news” scenarios if approvals become reality, as expectations may already influence current pricing.
XRP continues consolidation near critical technical levels as October developments approach, with quarterly seasonal patterns suggesting potential volatility ahead.
Get 3 Free Stock Ebooks
Discover top-performing stocks in AI, Crypto, and Technology with expert analysis.
- Top 10 AI Stocks - Leading AI companies
- Top 10 Crypto Stocks - Blockchain leaders
- Top 10 Tech Stocks - Tech giants

