

TLDR
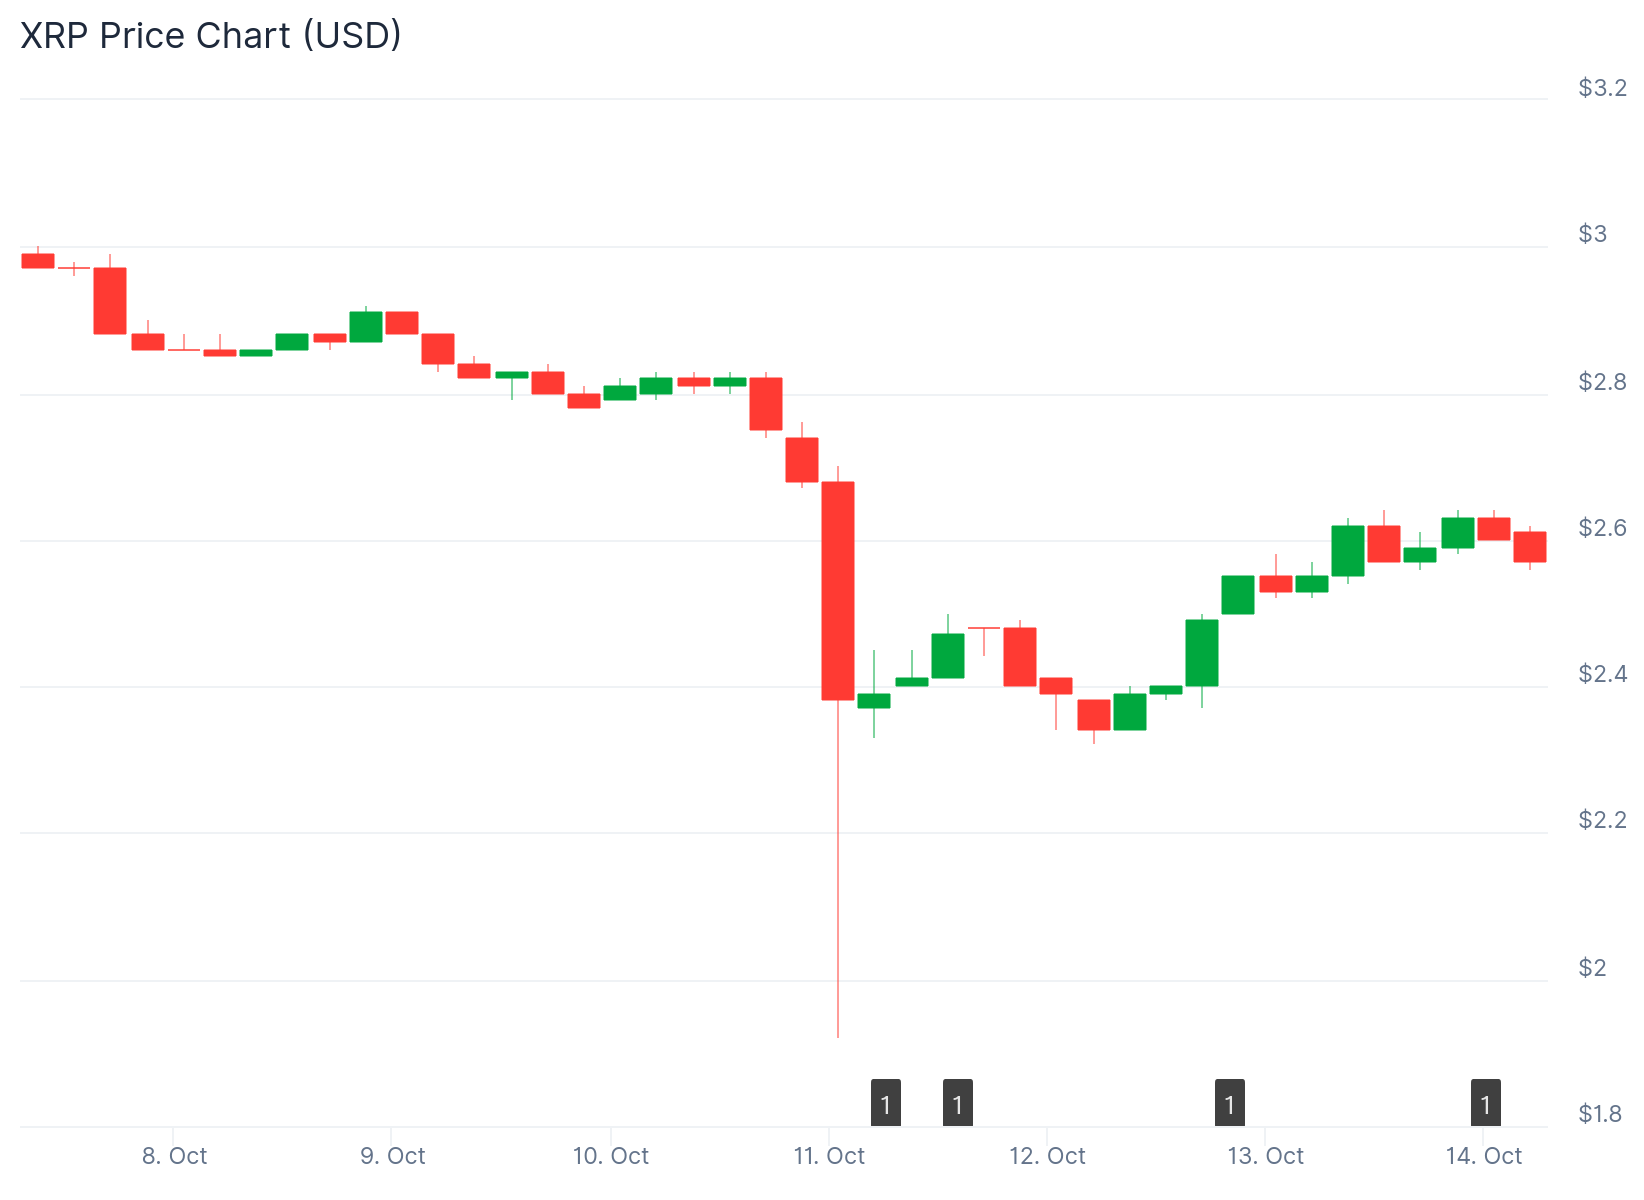
- XRP is currently trading at $2.60 with a 24-hour gain of 8.76% and $15.73 billion in trading volume.
- A capitulation pattern similar to 2017 has emerged, which previously preceded a major rally six weeks later.
- Critical resistance levels are positioned at $2.75 and $3.65, with support zones at $2.30 and $2.00.
- Veteran trader Peter Brandt praised XRP’s chart for its clean technical structure and classical patterns.
- The token’s next move depends on Bitcoin’s market direction and whether Bitcoin Dominance declines.
XRP is experiencing a strong recovery following a recent market dip. The token is trading at $2.60 at press time. Over the past 24 hours, XRP has gained 8.76%.
Trading volume for the token reached $15.73 billion in the last 24 hours. XRP’s market capitalization currently stands at $156.80 billion. The price action has attracted attention from traders and analysts.
Crypto analyst CRYPTOWZRD identified a capitulation pattern in XRP’s recent price movement. He compared this pattern to a similar event that occurred in 2017. After that 2017 capitulation, XRP rallied six weeks later.
The analyst noted that both XRP and the XRP/BTC pair closed positively. Further upward movement in XRP/BTC depends on Bitcoin Dominance decreasing. CRYPTOWZRD is monitoring intraday charts for potential short-term trading setups.
Chart Patterns Show Mixed Signals
Weekly candles for XRP and XRP/BTC closed slightly bearish due to a liquidation cascade. However, most of the downward pressure has already played out. The daily chart displays a bullish close, suggesting renewed confidence in the token.
The first major resistance level is at $2.75. If XRP breaks above this price, the next target is $3.65. Failure to maintain levels above $2.75 could lead to sideways trading until market sentiment improves.

Support levels are located at $2.30 and $2.00. A pullback from current levels could result in a move toward these support zones. Liquidation of leveraged positions may continue to affect spot market pricing.
Veteran Trader Highlights Technical Structure
Veteran trader Peter Brandt recently commented on XRP’s long-term chart structure. He called it “a purer long-term chart” because of its textbook adherence to classical technical patterns. The weekly chart shows multiple symmetrical triangles formed during consolidation phases.
Similar patterns appeared between 2014-2017 and 2020-2024. Both periods were followed by upward breakouts. Current resistance sits near $2.83 around the simple moving average.
The ADX momentum indicator currently reads 21.52. This indicates weak trend strength at present. However, it also suggests potential for increased volatility in the near future.
Ripple’s partial legal victory over the SEC in 2023 provided clarity on XRP’s regulatory status. This development helped bring institutional players back to the market. Ripple continues to develop cross-border payment solutions that utilize XRP.
Bitcoin Connection Remains Strong
XRP historically follows Bitcoin’s bull cycles with magnified moves once momentum builds. Breaking decisively above $3.00 is viewed as critical for triggering another sustained rally. Intraday trading showed XRP testing resistance at $2.55.
Trading above $2.55 might spark a near-term upward surge. Analysts recommend waiting for clearer chart patterns before entering new positions. A retest of support near $2.00 remains possible before any breakout occurs.
XRP’s near-term direction will largely align with Bitcoin’s market sentiment. The token continues to test higher levels, with the $2.75 resistance being the immediate hurdle. Trading volume and market cap remain strong indicators of continued interest in the token.
Get 3 Free Stock Ebooks
Discover top-performing stocks in AI, Crypto, and Technology with expert analysis.
- Top 10 AI Stocks - Leading AI companies
- Top 10 Crypto Stocks - Blockchain leaders
- Top 10 Tech Stocks - Tech giants

