

TLDR
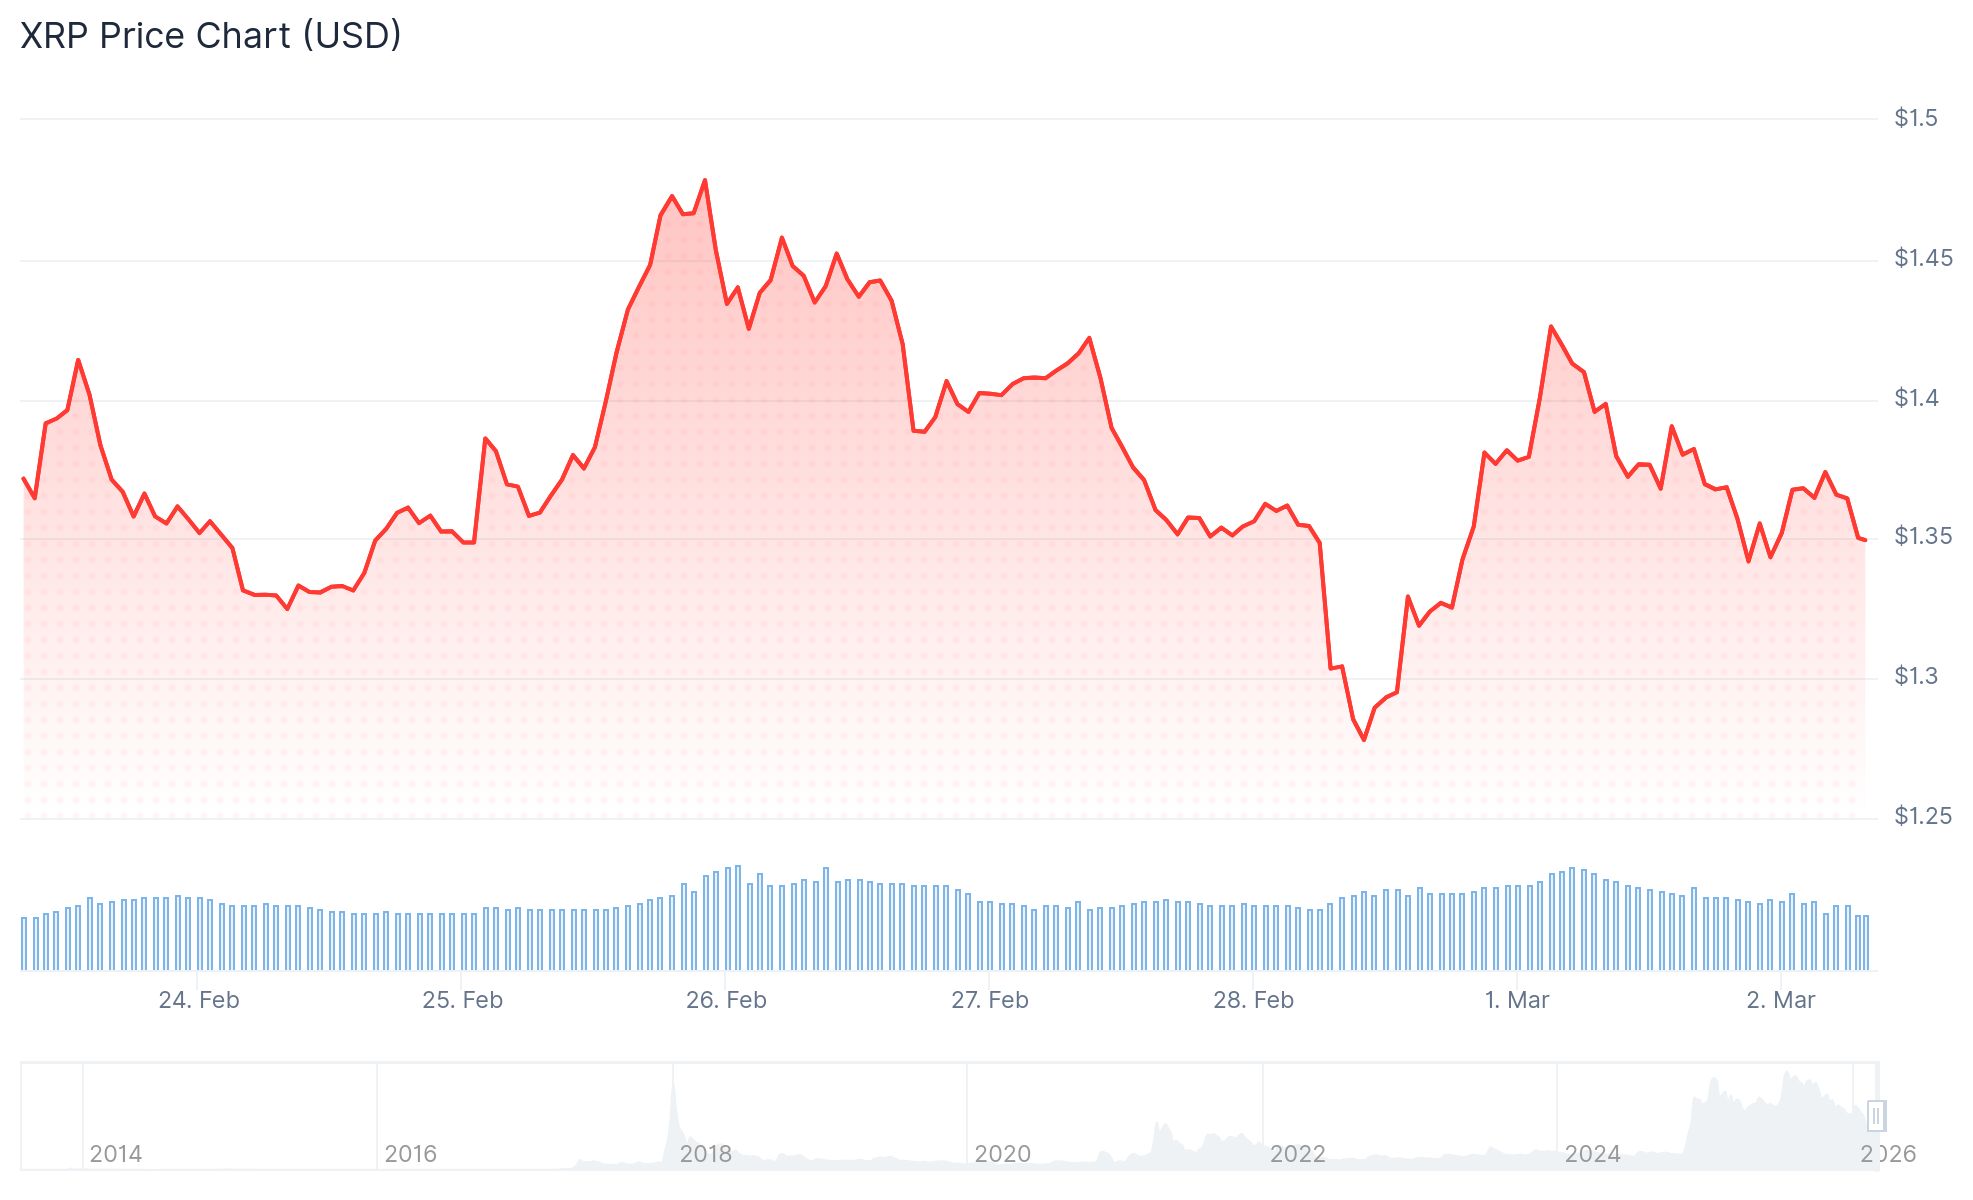
- Ripple’s XRP token declined more than 4% within a 24-hour period, settling near $1.37 amid heightened global uncertainty
- Approximately 472 million XRP tokens (valued at roughly $652 million) moved onto Binance during the past seven days
- Iranian official Ali Larijani dismissed claims of diplomatic engagement with Washington, intensifying market anxiety
- Technical analysis reveals a developing bear pennant formation that could drive prices down to $0.86
- Critical resistance level identified at $1.40–$1.42 range; breakdown below $1.30 may trigger further declines
Ripple’s XRP token experienced a sharp decline exceeding 4% during Monday’s trading session, hovering around the $1.37 mark as escalating tensions involving the United States, Israel, and Iran sent shockwaves through global risk markets.
Weekend developments involving reported military action between US-Israeli forces and Iran sparked widespread selling across cryptocurrency platforms. The incident’s occurrence during after-hours trading for traditional markets magnified the market response.
Ali Larijani, Iran’s national security adviser, subsequently rejected suggestions that Tehran had reached out to Washington via Omani intermediaries, stating unequivocally that Iran “will not negotiate with the United States.” This declaration intensified market uncertainty.
Precious metals like gold experienced significant gains as investors sought refuge in traditional safe-haven assets, while digital currencies suffered losses alongside equities and other risk-oriented investments.
Blockchain analytics platform CryptoQuant revealed that over 472 million XRP tokens—approximately $652 million in value—were transferred to Binance during the previous seven-day period. Market observer Darkfost characterized it as “the largest inflow period of the month of February.”
Large-scale transfers to exchanges don’t necessarily indicate imminent selling pressure. Such movements can represent various strategies including liquidity optimization, margin requirements, or protective hedging during periods of elevated volatility.
Nevertheless, Darkfost observed that substantial inflows “often signal a potential willingness to sell or at least to position liquidity closer to the market.”
Binance’s XRP holdings had been steadily decreasing since October 2025, making this recent week’s influx a notable shift in that trajectory.

Technical Picture
Chart analysis reveals XRP is developing a bear pennant configuration on daily timeframes. This formation commonly emerges following steep declines and generally continues in the direction of the preceding move.
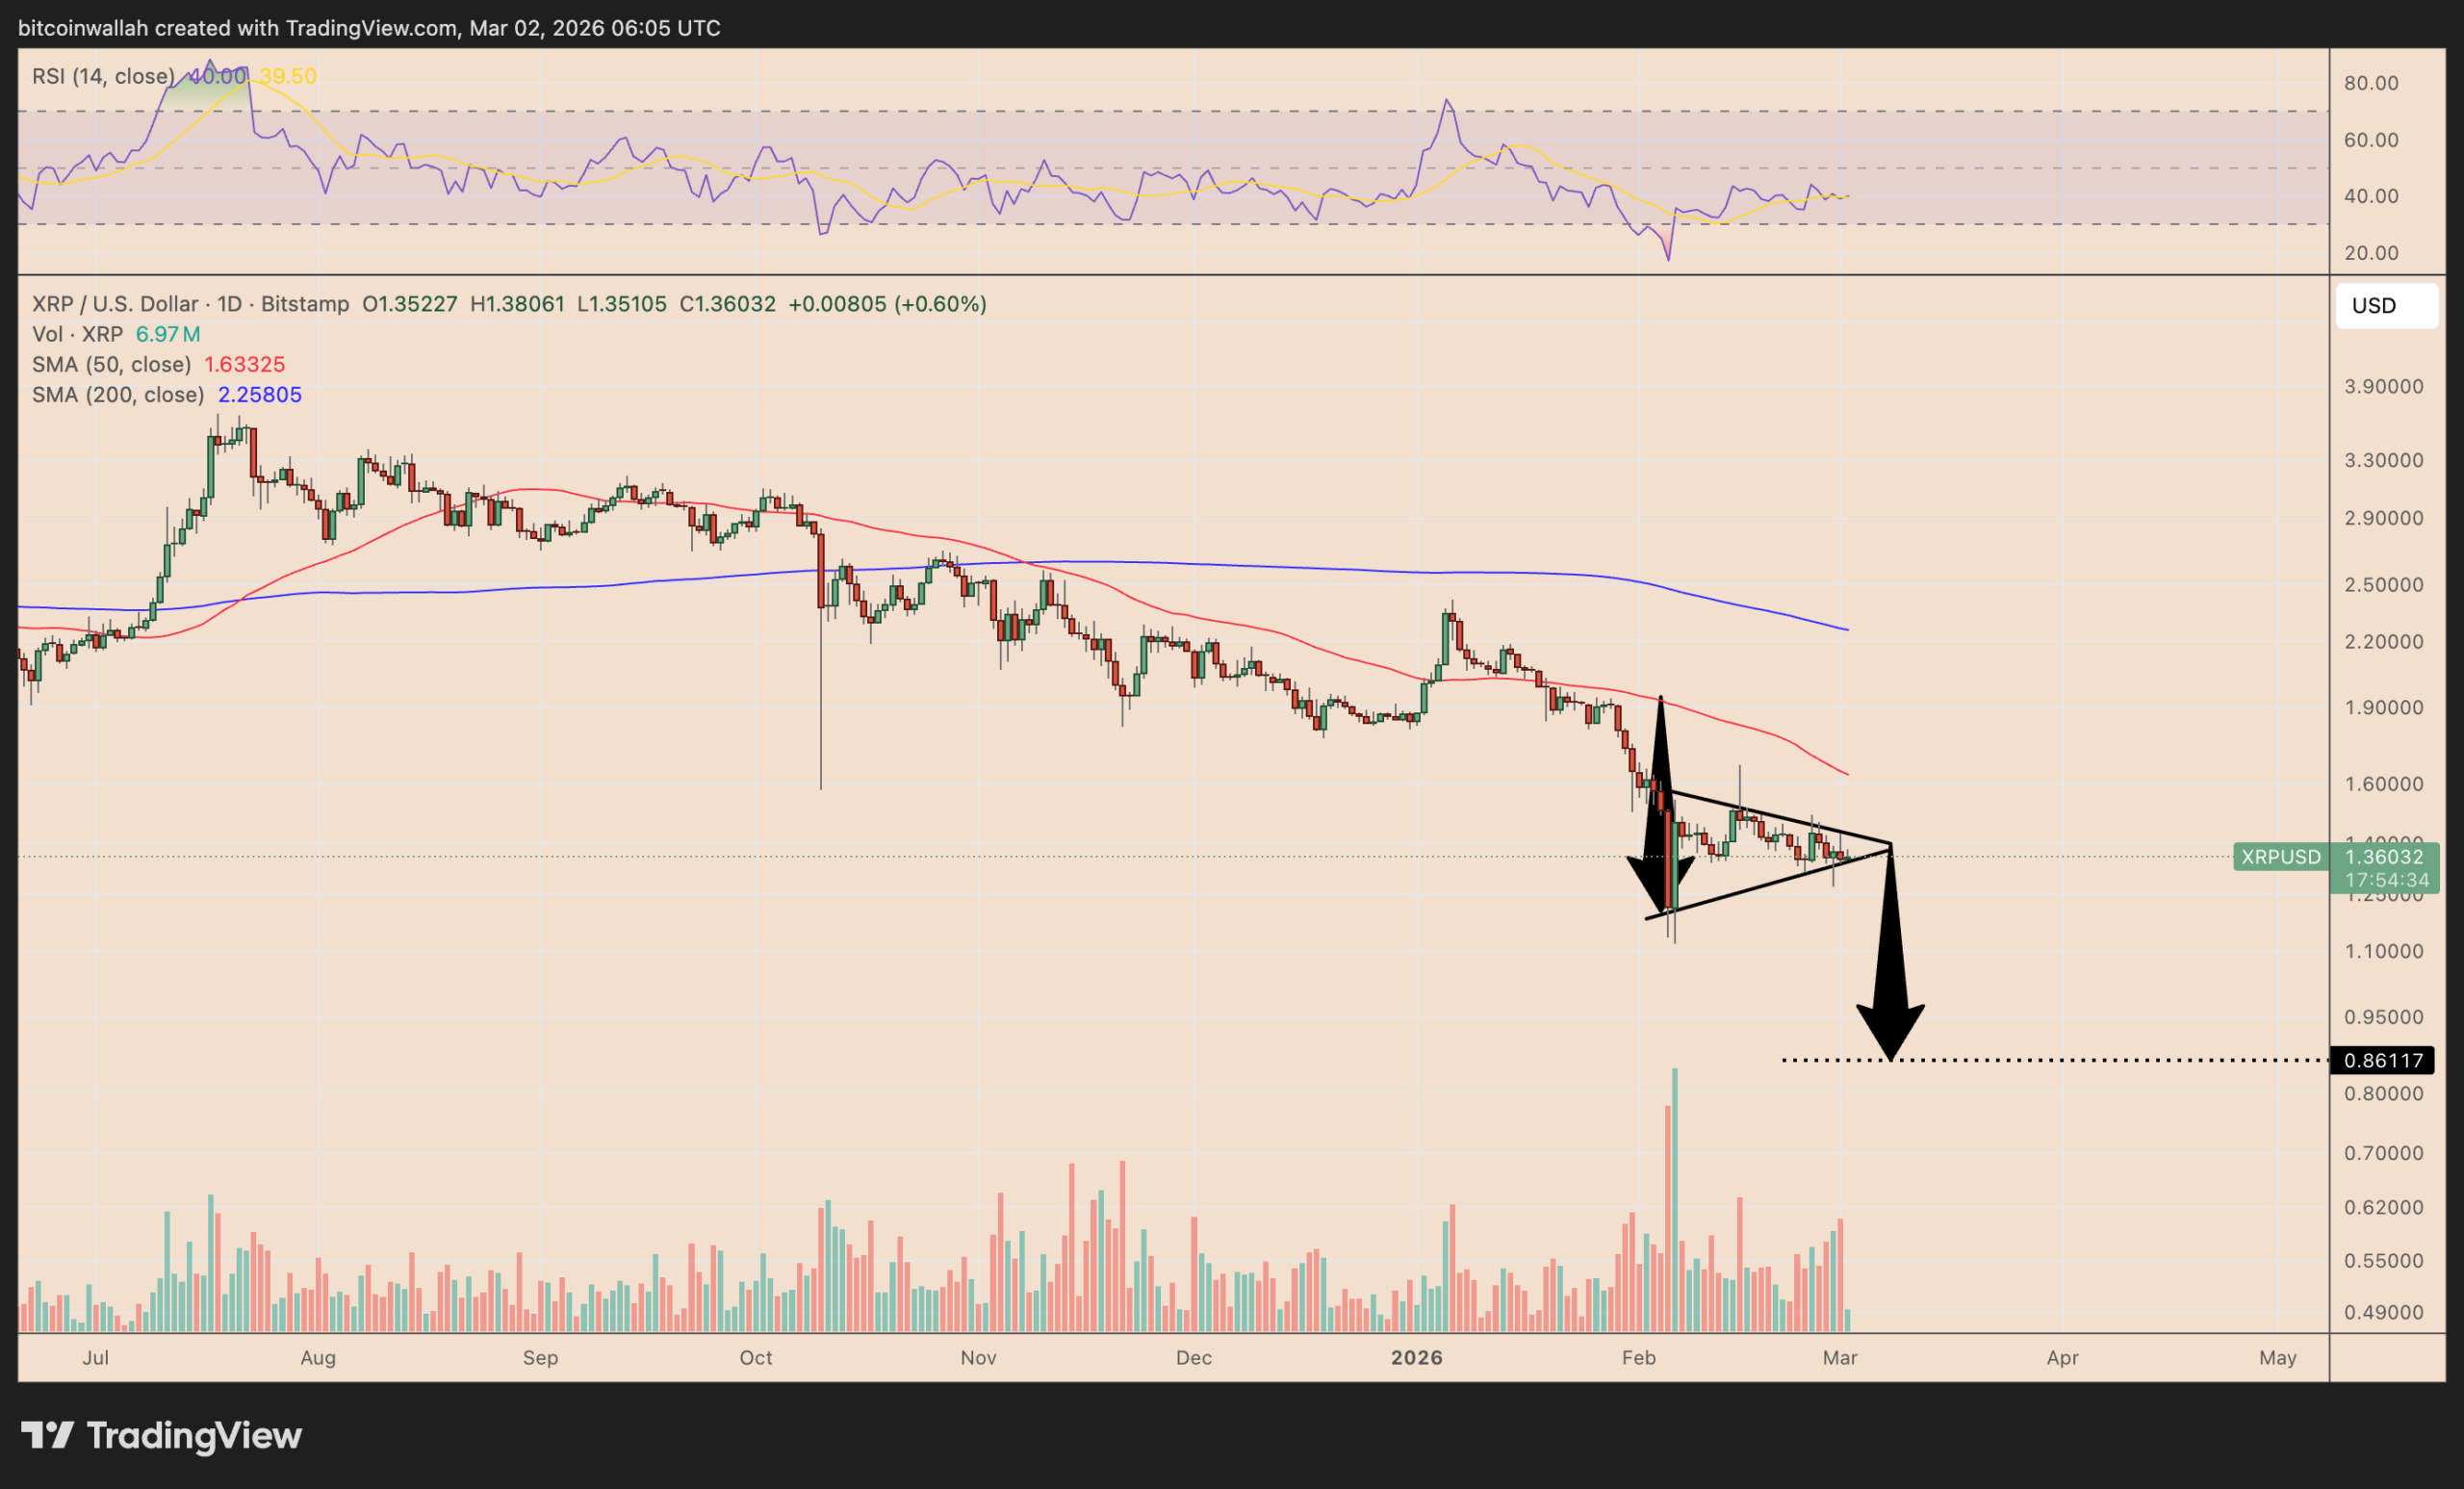
The token has been trading within a narrowing range characterized by descending peaks testing support around the $1.30–$1.35 zone. Current pricing remains beneath both the 50-day simple moving average (approximately $1.63) and the 200-day simple moving average (roughly $2.26).
Should XRP breach the pennant’s lower trendline, technical projections suggest a measured decline toward $0.86—representing approximately 35% downside from present valuation.
Upside resistance barriers appear at $1.4080, corresponding to the 61.8% Fibonacci retracement level calculated from the $1.4936 high to $1.2702 low. Sustained trading above this threshold could unlock movement toward $1.42 and subsequently $1.44.
On-Chain Signals
Glassnode’s MVRV Extreme Deviation Bands indicate XRP is gravitating back toward its average cost-basis level. Extended weakness could bring the -$0.5σ band near $1.00 into play as the next significant support zone.
This positions $1.00 as an initial downside objective, with $0.86 becoming relevant if the bear pennant pattern confirms through a decisive breakdown.
As of the latest update, XRP was changing hands at $1.37, with exchange inventories showing modest increases following the substantial weekly inflows.
Get 3 Free Stock Ebooks
Discover top-performing stocks in AI, Crypto, and Technology with expert analysis.
- Top 10 AI Stocks - Leading AI companies
- Top 10 Crypto Stocks - Blockchain leaders
- Top 10 Tech Stocks - Tech giants

