
 Eyes $1.40 Breakout as Bulls Challenge Critical Resistance Level")
Key Takeaways
- The digital asset gained momentum following a breakout above a descending trend line on the one-hour timeframe.
- XRP touched $1.3963 before experiencing minor profit-taking, maintaining position above the 100-hour simple moving average.
- Market participants are closely monitoring the $1.3880 to $1.40 range as the primary resistance cluster.
- Downside cushions are positioned around $1.3575 and $1.3330 should bullish momentum fade.
- While ETF capital flows and policy developments showed positive trends, technical indicators remain divided.
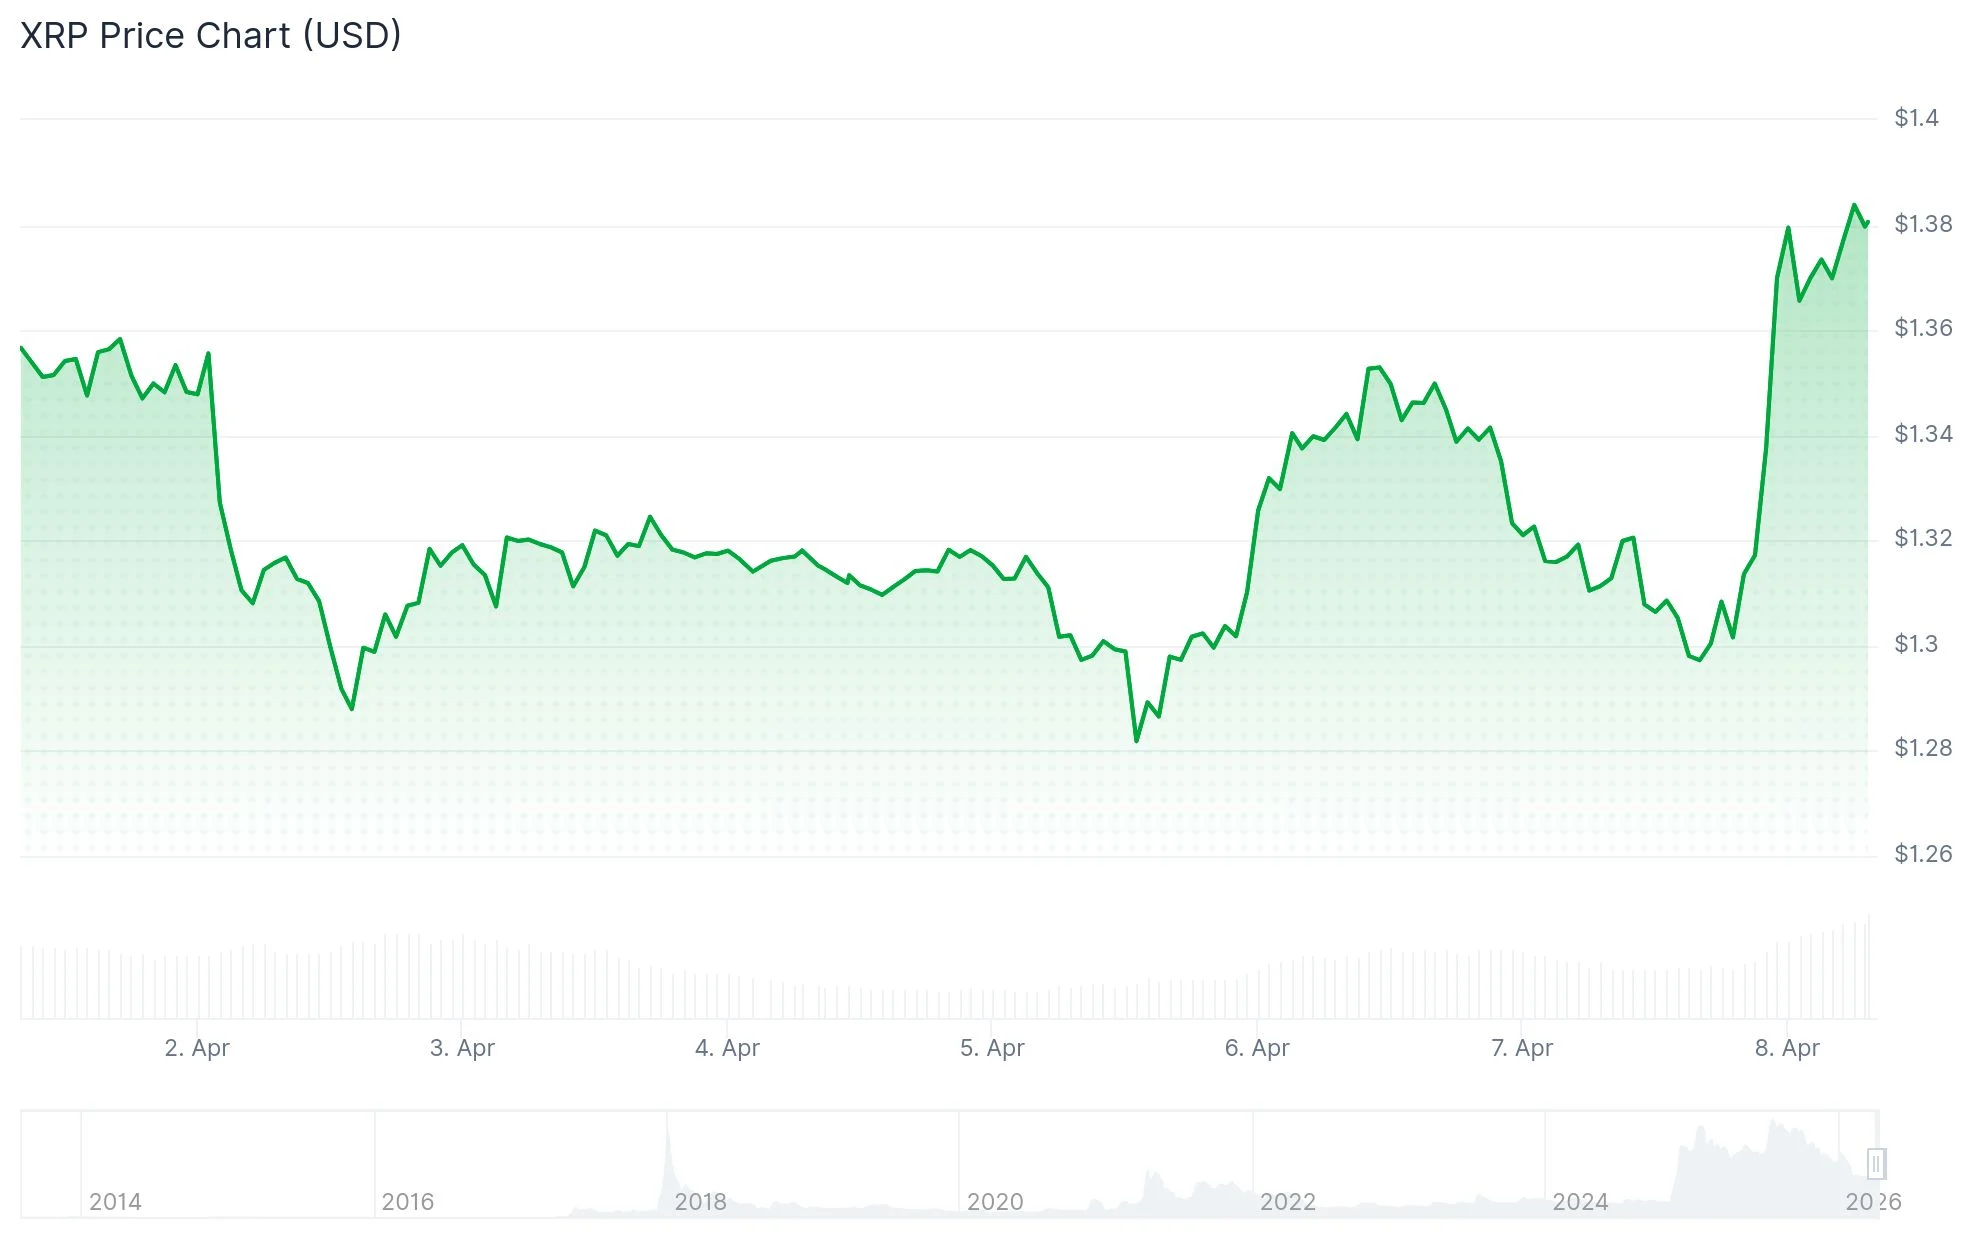
XRP (XRP) demonstrated upward momentum and closed in on the $1.40 threshold during a recent intraday advance. The cryptocurrency was changing hands around $1.38 following a peak at $1.3963.
The bullish action initiated after the token cleared the $1.350 and $1.3550 thresholds. Purchasing pressure subsequently drove prices through the $1.3650 barrier.
Chart analysis revealed that XRP also penetrated a downward-sloping trend line positioned near $1.3350 on the hourly timeframe. This technical development provided additional fuel for the upward trajectory.
Following the $1.3963 high, the asset experienced modest retracement. Nevertheless, pricing held firm above both $1.3550 and the 100-hour simple moving average.
This dynamic places emphasis on upcoming resistance barriers. Market observers are assessing whether XRP can penetrate $1.3880 followed by the $1.40 mark.

Key Resistance Levels Under Scrutiny
Should XRP successfully breach $1.40, subsequent targets emerge around $1.4250 and $1.4450. Further upside potential exists near the $1.4650 threshold.
Near-term technical structure indicates buyers currently maintain the upper hand. The cryptocurrency continues trading above its primary moving average following the recent advance.
Separate market analysis indicated XRP registered a 5.63% daily gain, reaching approximately $1.3848. This positioning places the asset above its 20-day moving average, though it remains beneath both the 50-day and 200-day averages.
The same technical assessment identified the Ichimoku Kijun indicator at $1.4429. This benchmark sits above current pricing and contributes to the overhead resistance cluster.
Downside Protection Zones in Place
If XRP encounters rejection at the $1.3880 resistance cluster, downward pressure could reemerge. Initial support emerges around $1.3575.
Further down, the next significant floor appears near $1.3330. This threshold aligns with the 61.8% Fibonacci retracement of the upward swing from $1.2940 through $1.3963.
A decline beneath $1.3330 would bring $1.3080 and $1.3020 into view. Additional downside protection below these levels is positioned near $1.2750.
Additional market commentary noted XRP has been confined to a narrow $1.37 to $1.39 corridor despite robust institutional capital inflows. The analysis highlighted that United States spot XRP exchange-traded funds have accumulated over $1 billion since their introduction, with $224 million arriving in the most recent week.
The report further noted technical oscillators presented conflicting signals, with the RSI exhibiting bullish characteristics while the Stoch RSI indicated overbought territory. Market analyst Anton Kharitonov expressed a cautious stance pending a decisive breakthrough above $1.39.
Finance Bull highlighted XRP’s breakout coinciding with the two-week ceasefire and Strait of Hormuz reopening developments, suggesting potential for extended bullish action. The commentary conveyed optimistic sentiment, though specific technical price objectives were not detailed beyond the general outlook.
At present, the immediate technical picture remains straightforward: XRP is testing the $1.3880 to $1.40 resistance zone after advancing from the $1.2940 base.
Get 3 Free Stock Ebooks
Discover top-performing stocks in AI, Crypto, and Technology with expert analysis.
- Top 10 AI Stocks - Leading AI companies
- Top 10 Crypto Stocks - Blockchain leaders
- Top 10 Tech Stocks - Tech giants

