
 Price Analysis: $50.8B in Underwater Positions Signal Investor Pain")
Key Takeaways
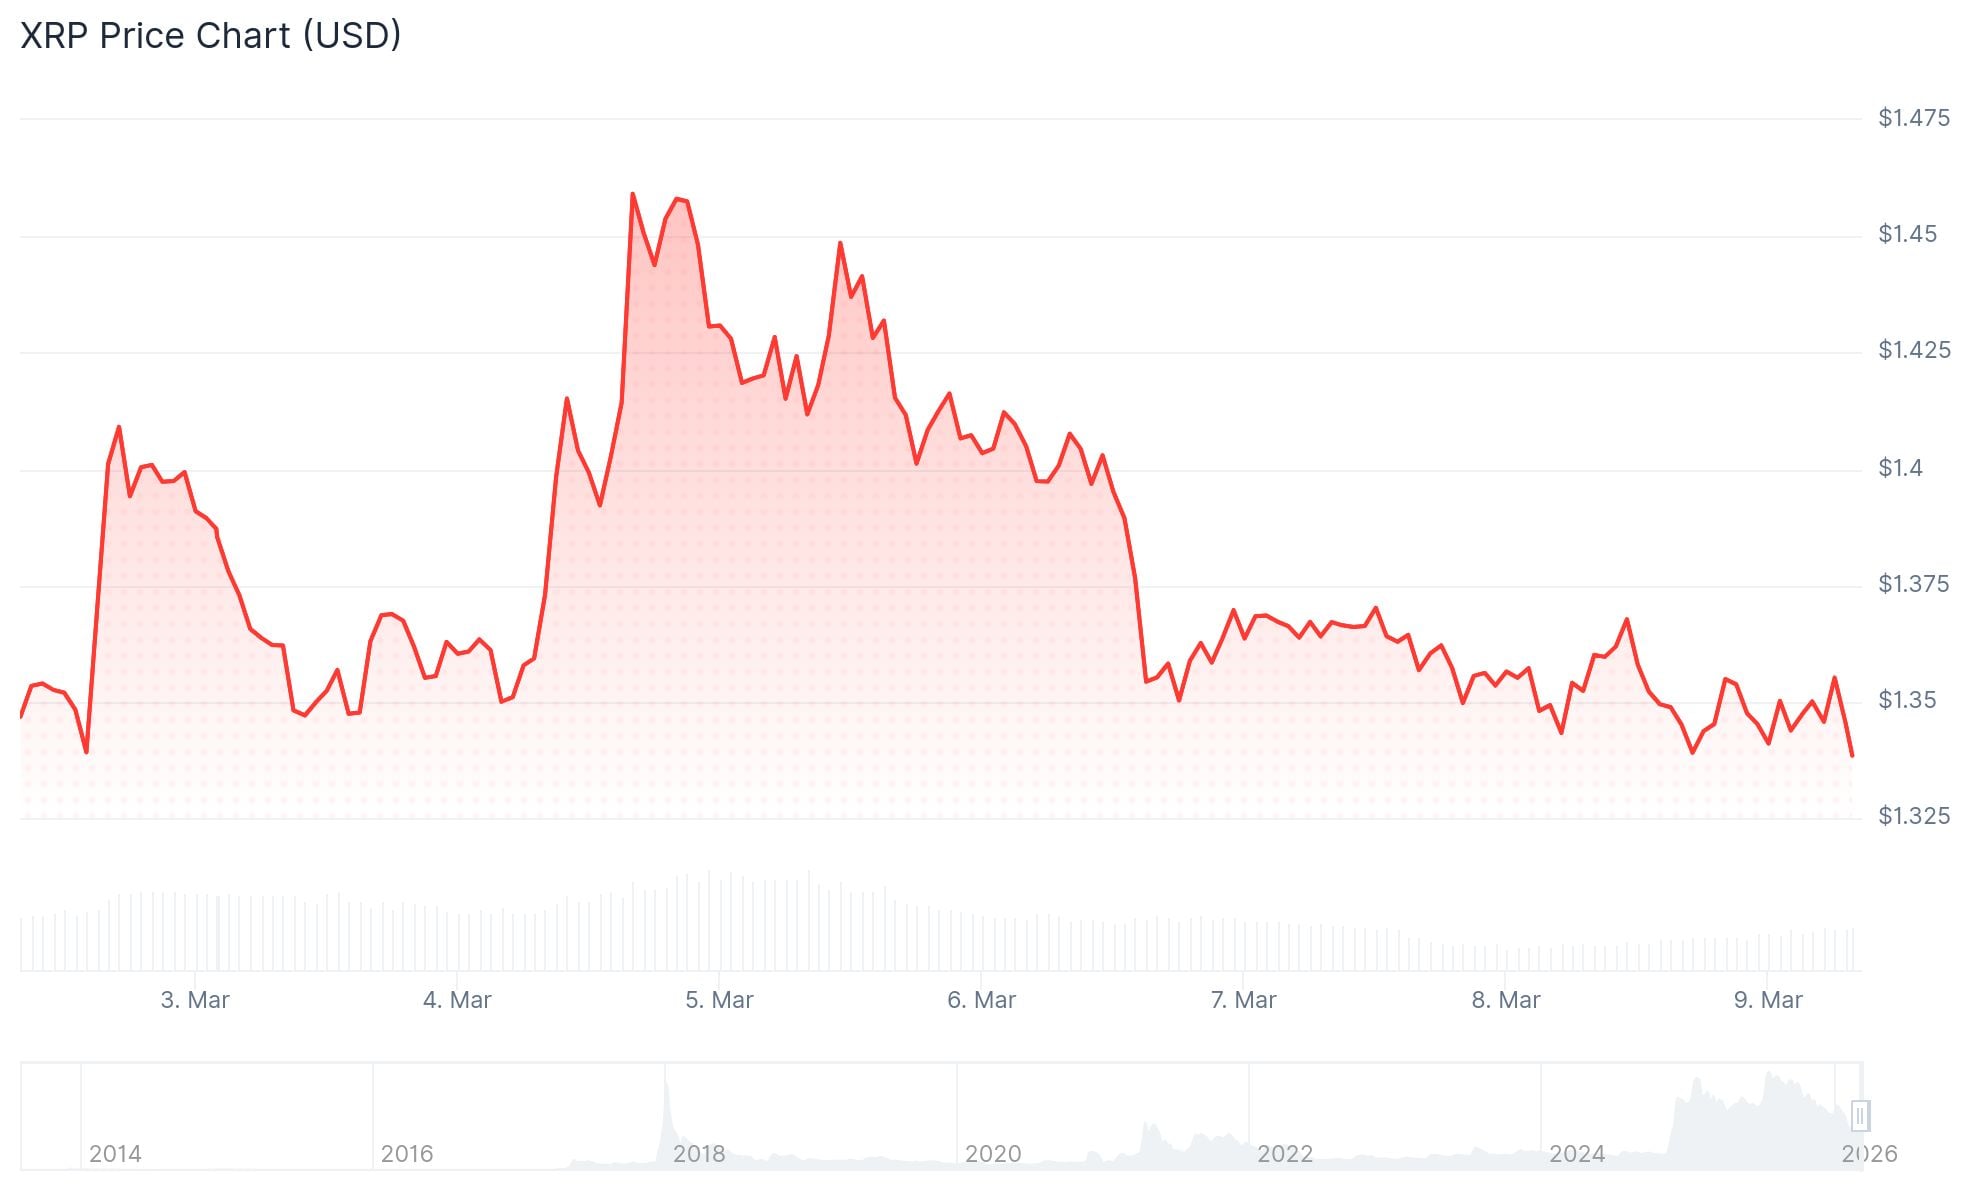
- XRP currently sits at approximately $1.34, representing a 64% decline from its January 2018 all-time high of $3.84.
- Blockchain analytics reveal 36.8 billion XRP tokens are underwater, accounting for $50.8 billion in unrealized losses.
- Critical support level established at $1.33; breakdown could trigger further decline toward $1.25.
- Technical indicators including MACD and Chaikin Money Flow suggest continued bearish pressure in the near term.
- Should Bitcoin breach $60,000, market watchers identify $0.85–$0.95 as XRP’s next significant support area.
XRP continues to face downward pressure throughout this trading week, hovering around the $1.34 mark following the loss of crucial support thresholds. The digital asset has now erased nearly two-thirds of its peak valuation.
Blockchain analytics platform Glassnode reports that 36.8 billion XRP tokens are presently trading below their acquisition cost. This represents roughly $50.8 billion in paper losses distributed across the XRP ledger.
The digital asset reached its peak valuation of $3.84 during January 2018. Current trading levels place XRP approximately 64% beneath that historical benchmark.
During 2025, XRP experienced substantial momentum. The cryptocurrency surpassed $1, then $2, and ultimately exceeded $3, pushing virtually all circulating tokens into profitable territory. This favorable situation has since deteriorated significantly.
Following a temporary rebound in January 2026, XRP encountered renewed selling intensity throughout February. Subsequently, the asset has struggled to mount any substantial recovery and continues trending toward the bottom of its established range.

Critical Technical Indicators
XRP is presently positioned beneath both the $1.3550 threshold and its 100-hour simple moving average. A descending trend line has emerged on the hourly timeframe, establishing resistance near $1.3520.
The MACD oscillator remains positioned marginally below the neutral line, indicating diminished bullish momentum. The Chaikin Money Flow metric registers approximately -0.27, reflecting persistent fund withdrawals and reinforcing the bearish near-term outlook.
Immediate overhead resistance emerges at $1.38. Breaking above this barrier could propel XRP toward $1.40 and potentially $1.50. Conversely, losing the $1.33 support floor could expose $1.30 and deeper levels.
Wider Cryptocurrency Market Dynamics
The aggregate cryptocurrency market capitalization declined 1.19% to $2.3 trillion over a 24-hour span. Bitcoin experienced a 1.12% reduction to $67,166 during this timeframe. Spot Bitcoin exchange-traded funds recorded more than $348 million in net outflows earlier this week.
One market analyst suggested that a Bitcoin decline beneath $60,000 could drive XRP to test the $0.85–$0.95 zone. A more severe contraction to $0.56–$0.66 would potentially signal complete market capitulation, according to their assessment.
The present magnitude of supply held at a loss is nearing levels observed during prior bear market cycles, based on Glassnode analytics.
XRP most recently traded at $1.34, according to CoinGecko pricing data.
Get 3 Free Stock Ebooks
Discover top-performing stocks in AI, Crypto, and Technology with expert analysis.
- Top 10 AI Stocks - Leading AI companies
- Top 10 Crypto Stocks - Blockchain leaders
- Top 10 Tech Stocks - Tech giants

