
 Trades Near Critical $1.40 Level as Bulls Eye Recovery")
Key Takeaways
- XRP currently sits at $1.39, reflecting a 3.46% decline over the past day
- The digital asset is finding stability at the critical $1.40 support threshold following recent weakness
- A successful breach of the $1.45–$1.50 resistance zone could trigger a bullish reversal
- The Relative Strength Index registers at 46, positioned below the neutral 50 threshold, indicating subdued momentum
- Failure to hold the $1.3850 level may trigger further downside toward $1.3620 or deeper
XRP continues to defend a crucial technical threshold following a wave of selling activity. The cryptocurrency has retreated from its recent peak and is now forming a consolidation pattern around the $1.40 mark.
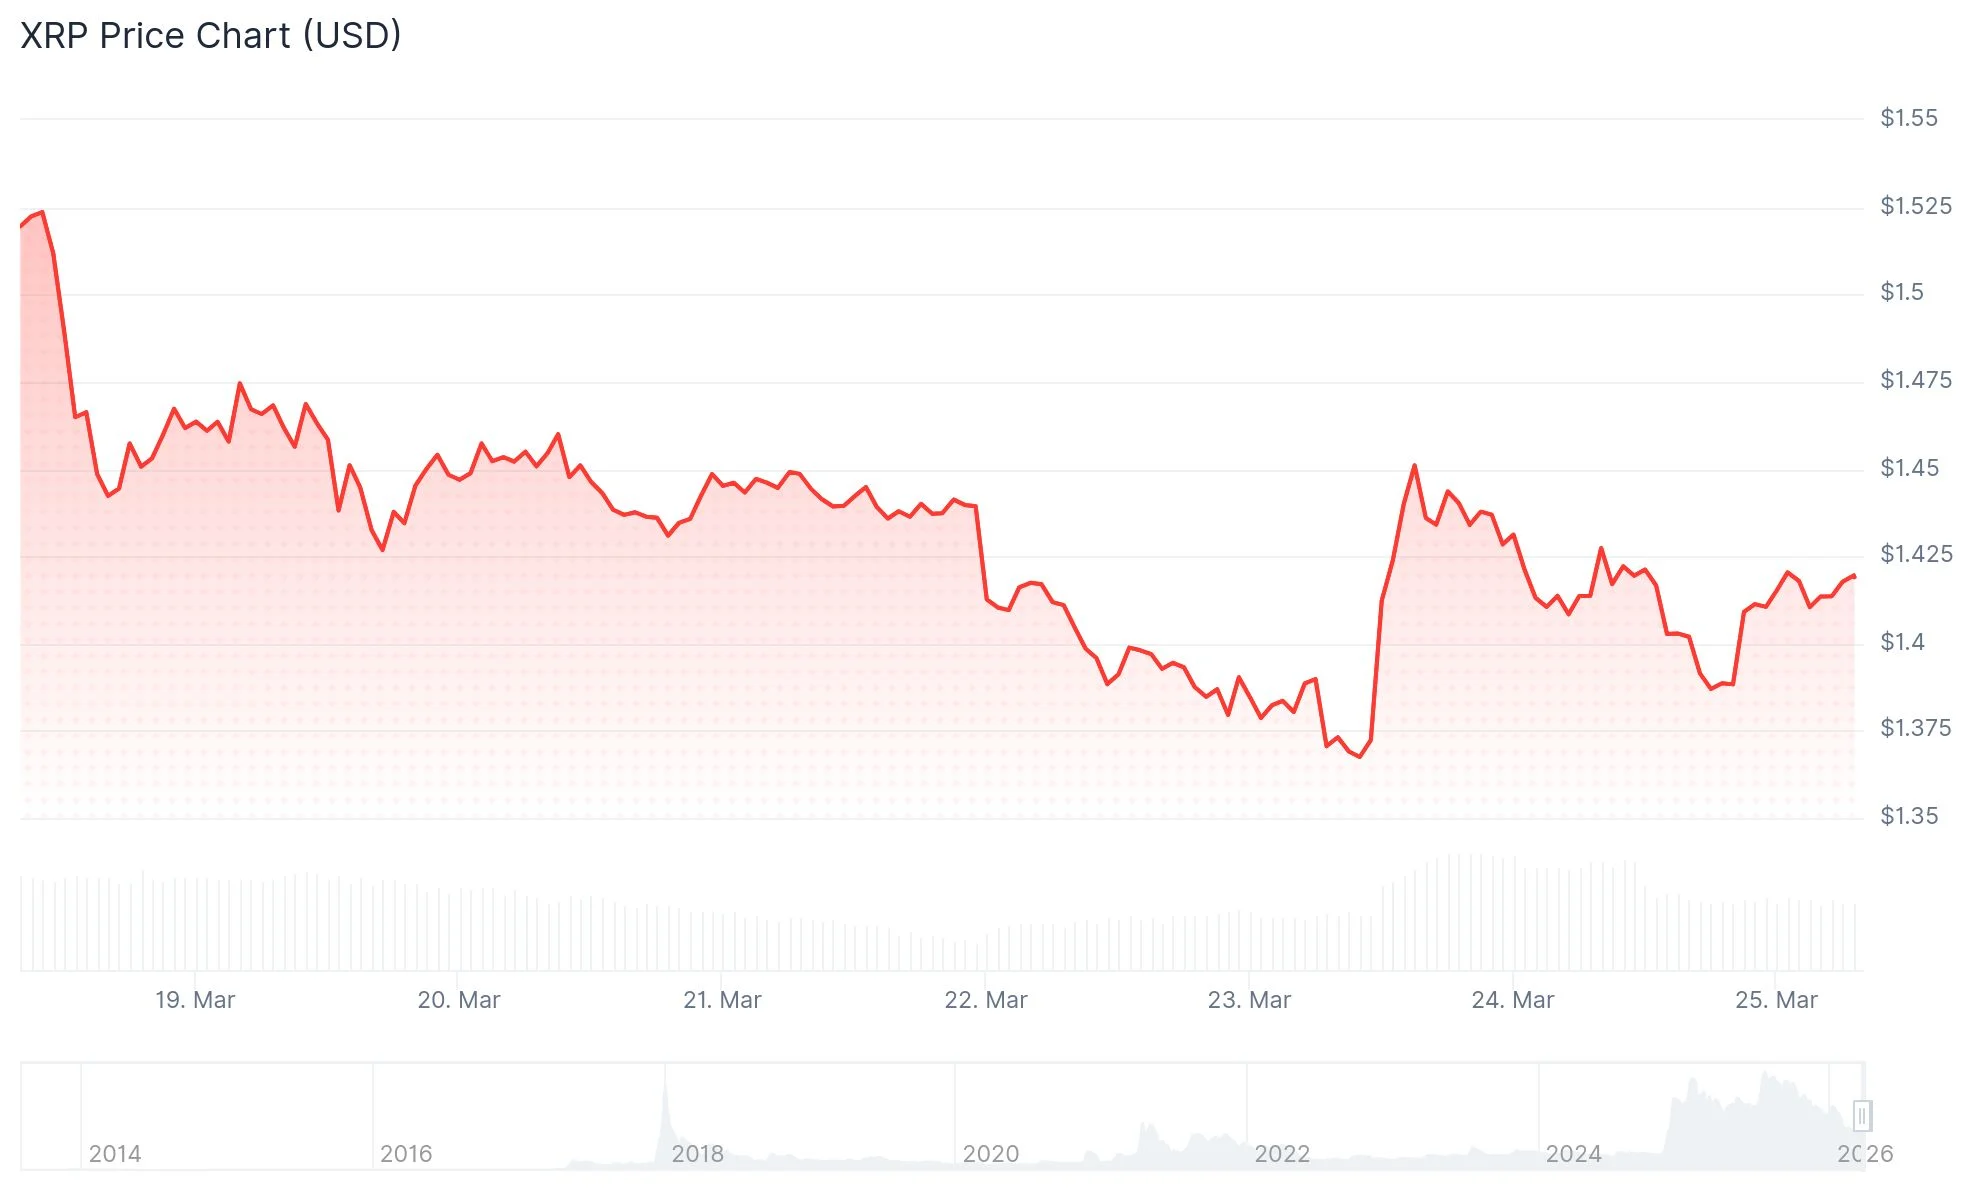
As of this analysis, XRP is changing hands at $1.39. The 24-hour trading volume stands at $3.16 billion while the market capitalization reaches $85.87 billion, based on CoinMarketCap data. The token has experienced a 3.46% contraction over the last 24-hour period.
The cryptocurrency recently climbed beyond the $1.41 and $1.42 levels before reaching a session high of $1.4650. Subsequently, profit-taking emerged, driving the price back underneath $1.45 and $1.44.
The decline pushed XRP beneath the 61.8% Fibonacci retracement level, calculated from the upward movement between $1.3612 and $1.4650. Demand materialized around $1.3850, coinciding with the 76.4% Fibonacci level, preventing additional losses.
Cryptocurrency analyst BitGuru observed on March 24 that XRP is navigating through what he identifies as a significant accumulation territory. According to his assessment, the price movement follows a breakdown from a descending wedge formation, with XRP seemingly establishing support at $1.40.

Technical Metrics Suggest Caution
The Relative Strength Index currently hovers around 46, remaining beneath the neutral 50 benchmark. This positioning indicates that bearish pressure continues to dominate market sentiment.
XRP is currently positioned below its 20-day exponential moving average at $1.41 and significantly beneath the 200-day moving average sitting at $2.09. The moving average structure reflects a bearish configuration.
The MACD indicator lines remain horizontal within negative territory. The absence of a bullish crossover suggests momentum has yet to shift in favor of purchasing activity.
Critical Price Zones Under Focus
Looking at overhead resistance, the initial barrier emerges near $1.4250. Clearing this hurdle would establish a pathway toward $1.44, followed by $1.4650.
A decisive breakout above $1.4650 may set sights on $1.50, with the subsequent target at $1.5250. Maintaining ground above $1.4250 remains essential for any sustainable upward movement.
Should XRP struggle to push higher, immediate support rests at $1.40. Additional safety nets exist at $1.3850, followed by $1.3620.
A definitive close beneath $1.3620 could accelerate selling pressure toward $1.35 or potentially down to $1.3320.
Market analyst Ali Charts shared via X that a significant trendline may present a compelling accumulation opportunity for XRP, highlighting the present support region as a favorable entry zone.
XRP remains positioned above $1.40 and the 100-hour Simple Moving Average, with current price behavior indicating a cautious stance among market participants.
Get 3 Free Stock Ebooks
Discover top-performing stocks in AI, Crypto, and Technology with expert analysis.
- Top 10 AI Stocks - Leading AI companies
- Top 10 Crypto Stocks - Blockchain leaders
- Top 10 Tech Stocks - Tech giants

