
 Surges Past Key Resistance as Trading Volume Jumps 50% – $600 Target in Focus")
Key Highlights
- Zcash gained more than 5% on Tuesday, advancing from $256.45 to approximately $269
- The cryptocurrency is challenging a crucial resistance area around $270 following a descending trendline breach
- For the first time since dropping from elevated levels, ZEC has recovered its daily 50 EMA
- Daily trading volume jumped 50.1% to reach $458.23 million
- Technical analysts have identified upside objectives at $300, with extended forecasts reaching $600 in bullish scenarios
Zcash (ZEC) delivered a robust performance on Tuesday, April 7, registering gains exceeding 5% as the price climbed from $256.45 to approximately $269. Currently, ZEC is changing hands at $269.66 with a total market capitalization of $4.48 billion, based on data from CoinMarketCap.
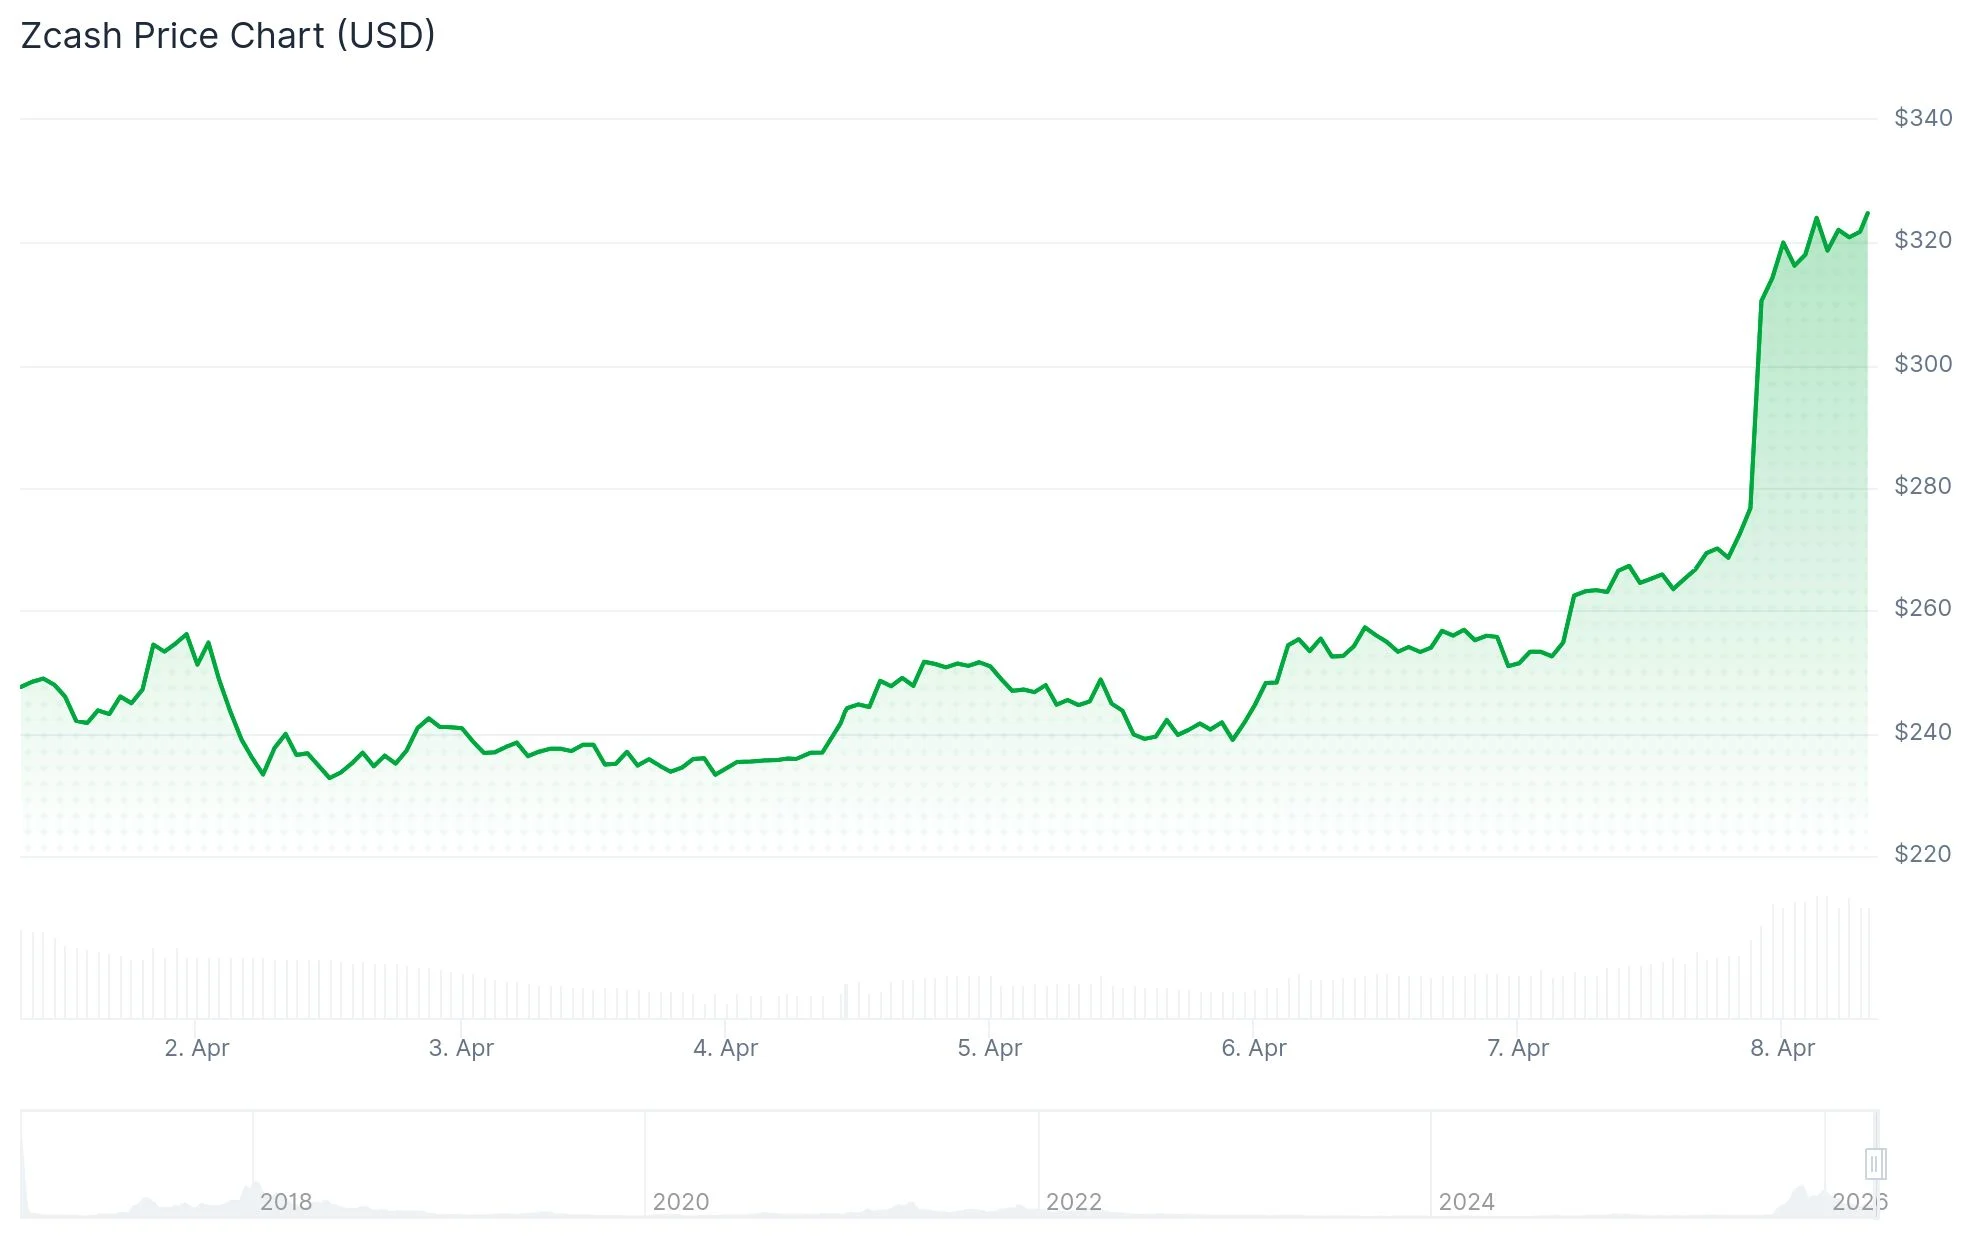
The 24-hour trading volume hit $458.23 million, representing a substantial increase of 50.1%. This heightened activity signals growing interest and stronger buyer participation across leading cryptocurrency exchanges.
Looking at the weekly timeframe, ZEC has appreciated 7.13% over the last seven days. This performance stands out as much of the wider cryptocurrency market has experienced sideways consolidation or downward pressure.
The recent advance has pushed ZEC into a resistance zone surrounding $270, a price level that has previously rejected upward movements on multiple occasions in recent months. Whether the cryptocurrency can break through and sustain gains above this threshold has become the focal point for market participants.
Additionally, ZEC has successfully recaptured its daily 50-day exponential moving average (50 EMA). This marks the first instance of this technical achievement since the asset declined from elevated price points earlier in the year. Market observers interpret this recovery as an indication of changing market momentum.

Technical Formation Emerges
Cryptocurrency analyst Ardi has identified a dual-level breakout structure developing on the charts. ZEC is simultaneously testing horizontal resistance near $270 and a descending trendline that has been defining the downtrend since January. A decisive daily close above this convergence zone would eliminate both technical obstacles simultaneously.
Should this breakout materialize, market analysts anticipate price movement toward $300 as the subsequent significant level. Conversely, if the breakout attempt proves unsuccessful, ZEC may retrace toward the $200–$220 demand area.
Analyst Whales_Crypto_Trading has drawn attention to a falling wedge pattern visible on the 12-hour timeframe. This chart pattern frequently precedes bullish reversals. The analyst has outlined near-term price objectives around $300, with an extended target potentially reaching $600 should bullish momentum persist.
Technical Indicator Analysis
The Relative Strength Index on the daily timeframe currently registers approximately 63. This reading indicates solid buying pressure while remaining below overbought territory. Meanwhile, the MACD indicator is displaying bullish signals, with the indicator lines crossing in an upward direction.
Both the 50-day and 200-day simple moving averages are now positioned beneath the current trading price, confirming that an uptrend structure is established.
Bollinger Bands have begun expanding, suggesting continued volatility in the near term. Immediate support is located near $249, while resistance stands around $290.
According to analyst Ardi’s trading strategy, potential entry positions exist between $260 and $268 on price pullbacks, with risk management via a stop loss positioned at $238. Profit-taking targets have been established at $282, $295, and $310.
At present, ZEC is trading at $269.66 with 24-hour volume measuring $458.23 million, marking a 50.1% increase compared to the prior session.
Get 3 Free Stock Ebooks
Discover top-performing stocks in AI, Crypto, and Technology with expert analysis.
- Top 10 AI Stocks - Leading AI companies
- Top 10 Crypto Stocks - Blockchain leaders
- Top 10 Tech Stocks - Tech giants

